Serverless Express with Logging and Tracing
Tags: javascript tutorial serverless aws
Introduction
If you have been following along, you will have a built an extremely simple API, auto-generated client code, and provided ways to authenticate users and authorize their requests. In this installment we will begin to take a look at how to determine the operational health of our API. In particular, we begin to look at our observability options for APIs hosted in AWS. The zeitgeist defines three pillars of observability - logging, tracing, and metrics. For the sake of brevity we will focus on logging and tracing. We will leave the third pillar, metrics, for a future post.
The goal here is to give you enough insight into the health and behaviour of your API. Without this information it is difficult/impossible to diagnose the source of errors in your application. The performance of your application is critical and you may find that varying types of load cause your application to behave differently. Logging and tracing can help you to triage and diagnose errors and bottlenecks in your code which results in a better experience for consumers of your application.
Logging
If you have ever written ‘console.log’ you will be familiar with logging. Printing out to the console is often one of the first things we learn, as part of the canonical ‘hello world’ example. Beyond that, most of us will write out to the console the moment we have an issue in our programs. That said, there are many things we can do to write better logs.
The first, and main thing we can do it to improve our logs is to introduce something popularly called ‘structured logging’. This primarily means settling on a standard format in which to log. This is not just limited to the ‘shape’ of the output, which include lines in JSON or some other format, but typically includes what various attributes should be included in the output.
A list of outputs that may be included for a typical structured logging line for a HTTP API, may include:
- The date-time of the log entry
- The log ‘level’, which may include,
-
- Error,
-
- Info,
-
- Debug, etc.
- Header attributes, which may include,
-
- Trace ID
-
- User-Agent
- The route of the API
- The method of the API
- The actual log message
Be careful not to include secret material or personally identifiable information (PII) into your logs. There exist various ways to scramble this information to prevent running afoul of this, whilst still retaining enough information to be useful.
The more information and attributes you able to log, the more likely the information will be useful in some capacity. Events with a lot attributes (resulting in lot ‘unique’ entries) are often referred to ‘high cardinality events’.
Tracing
Tracing is relatively new when compared to the now ancient practice of logging, and has come about as a means to understand actions rippling through distributed systems. In a monolith, the system has the complete context of the entire system at any one point in time. In a microservices architecture this is no longer true as the entire state of the system may be spread throughout many different services. Simple logging will no longer help us in understanding an event or action as it propogates through the system.
Tracing offers a deceptively simple solution to this problem; begin by adding what is called a ‘correlation identifier’ or ‘trace-id’ to every request/response, and propogate this through the system. If one of your services makes a call to another service, it should continue to pass this identifier through to the other service, and so on and so forth. Each service should log this information correlation ID out in addition to everything else it was already logging. If the logs for all services are then centralized, it is possible to use the correlation ID to construct a complete map of how a request propogated through the system.
Tracing is usually very request-response orientated and includes the time taken for each request-response cycle. This makes tracing very powerful in identifying bottlenecks and performance degradation in a system.
There exist many different standards/implementations for tracing, which have included OpenTracing, Jaegar, AWS X-Ray etc.
When to Log vs When to Trace?
It can be very difficult to distinguish when you should be logging versus when you should be tracing. There is an incredible amount of overlap between the two, so I’m going to limit myself to discussing what to do within the context of a serverless application running on AWS. There will be a fair amount of ‘opinion’ going on here so of course, take everything with a grain of salt and be prepared to use your own judgement.
We’ll start with tracing, because there is one clear advantage that is built in with X-Ray that you do not get with your own homegrown logging/tracing solutions, and this service integration. X-Ray is integrated with many different AWS services, and this gives you information in your traces that you will simply not be able to get any other way. An example of this is dynamodb service integration, in which the traces produced by the dynamodb service will include a lot of useful information about query performance. If you are building with serverless best practices which would include usage of as many managed services as possible, it would be senseless not to take advantage of this.
In addition, various AWS services will happily propogate your X-Ray trace IDs. This will enable you to create maps of request as they propogate through your services. Unfortunately, not every AWS service will propogate trace ID’s (event bridge being a notable example), and creating traces across account boundaries is a laborious process. If you have separated your services into different accounts, you may find ‘logging’ your traces or using a third party tracing service is necessary.
Which brings me to logging. I generally prefer to keep logging pretty simple. I will generally:
- Log the request as soon it is received, to give me enough context as to what ‘started’ the particular transaction.
- Log any information that would indicate branching logic, if it occurs. e.g. if, else, case statements.
- Log any unhandled errors that might occur, e.g. those I allow to flow up to the handler. If something is caught and recovered from - I consider that branching logic.
Most Lambda function runtimes will generally log any errors that are thrown from the handler. However, this does use the standard logging format provided by the specific runtime. If you have your own standard output format, you will probably want to catch any errors and log them. You will still probably want to rethrow those errors (thereby logging the output error twice), to ensure the lambda platform recognises that an error has occurred. This is particularly important if you are invoking lambda functions asynchronously and require the retry semantics that it offers.
Some of this will depend on how you structure your lambda code. I try to branch as little as feasibly possible, deferring to step functions for logic control/flow if it is required. As a result of this, it’s not uncommon to see only two logging statements in my code. I usually do not bother to log a statement that indicates success of a particular function, unless I need this information for constructing metrics. A lot of services have reasonable support for constructing this without needing to me explicitly console.log (like API Gateway), so this is not a step I would usually need to take for those scenarios.
However, if your organization specifies that they want you to log certain things in certain ways, I’d usually go with that even if it seems redundant. At the end of the day if your organization has invested in specific tooling you may be following the path of least resistance in doing so. Consider your own context when making decisions.
Understanding the Defaults
Before we get into custom logging and tracing, let’s investigate what is provided out-of-the-box and enable that.
Logs are provided in two locations in CloudWatch.
-
API Gateway logs are provided in the log group API-Gateway-Execution-Logs_{rest-api-id}/{stage-name}.
If you have deployed the API in this guide, your stage name will likely be ‘$default’. This doesn’t seem to be configurable via CloudFormation yet for HTTP APIs - but you can configure it via the console.
-
Logs for your lambda function are provided at ‘/aws/lambda/
'. -
If you are making API calls to AWS services - you will find a fair amount of things logged in CloudTrail
-
There’s addition logging for Cognito as well if you happen to need it. Which you may, if you concerned about specific logs around authentication.
Some tracing features are available out of the box; We previously enabled lambda X-Ray tracing through the use of the following snippet in the template.
Globals:
  Function:
    Timeout: 3
    Tracing: Active
Specifying this in the ‘Globals’ section of the template ensure that tracing is enabled for all lambda functions. The trace header identifier will be populated into an environment variable called ‘_X_AMZN_TRACE_ID’, that you can access within the lambda function. This trace ID will need to be used if to instrument downstream calls to other services, AWS or otherwise.
Add More Logging
If we were to view the logs for our existing API there would not be much additional information in the logs, particularly for successful invocations. Lets see what we can do to improve that.
We’ll start by installing a structured logging library. For this, we’ll use pino. Pino will output our logs in JSON format. Assuming you are in the directory of app.js file, executing the following command to install and save pino as a runtime dependency.
npm install --save pino
Next, we will need to configure Pino.
const newLogger = require('pino');

app.use((req, res, next) => {
    // We attach it to the request object to be used later
    // This creates a new logger per request.
    req['logger'] = newLogger();
    next();
});
We can use the logger in other places in the codebase, e.g. In our authorization middleware.
app.use((req, res, next) => {
    const { headers, method, logger, path: obj } = req;
    const token = headers['authorization'];
    const decoded = jwt.decode(token, { json: true });
    const { sub } = decoded;
    const groups = decoded['cognito:groups'] || [];
    const act = methodToAction[method];
    // By overwriting the logger, we can propogate the sub, obj, act
    // variables after the middleware has exited
    req.logger = req.logger.child({ sub, obj, act, groups })
    rbac.addRolesToUser(sub, groups).then(() => {
        rbac.enforce(sub, obj, act)
            .then(pass => {
                req.logger.info("Evaluating Access");
                if (pass) {
                    req.logger.info("Access Allowed");
                    next()
                } else {
                    req.logger.info("Access Denied");
                    res.status(403).json({ message: 'Forbidden' });
                }
            })
    })
});
This results in logs that look like the following:
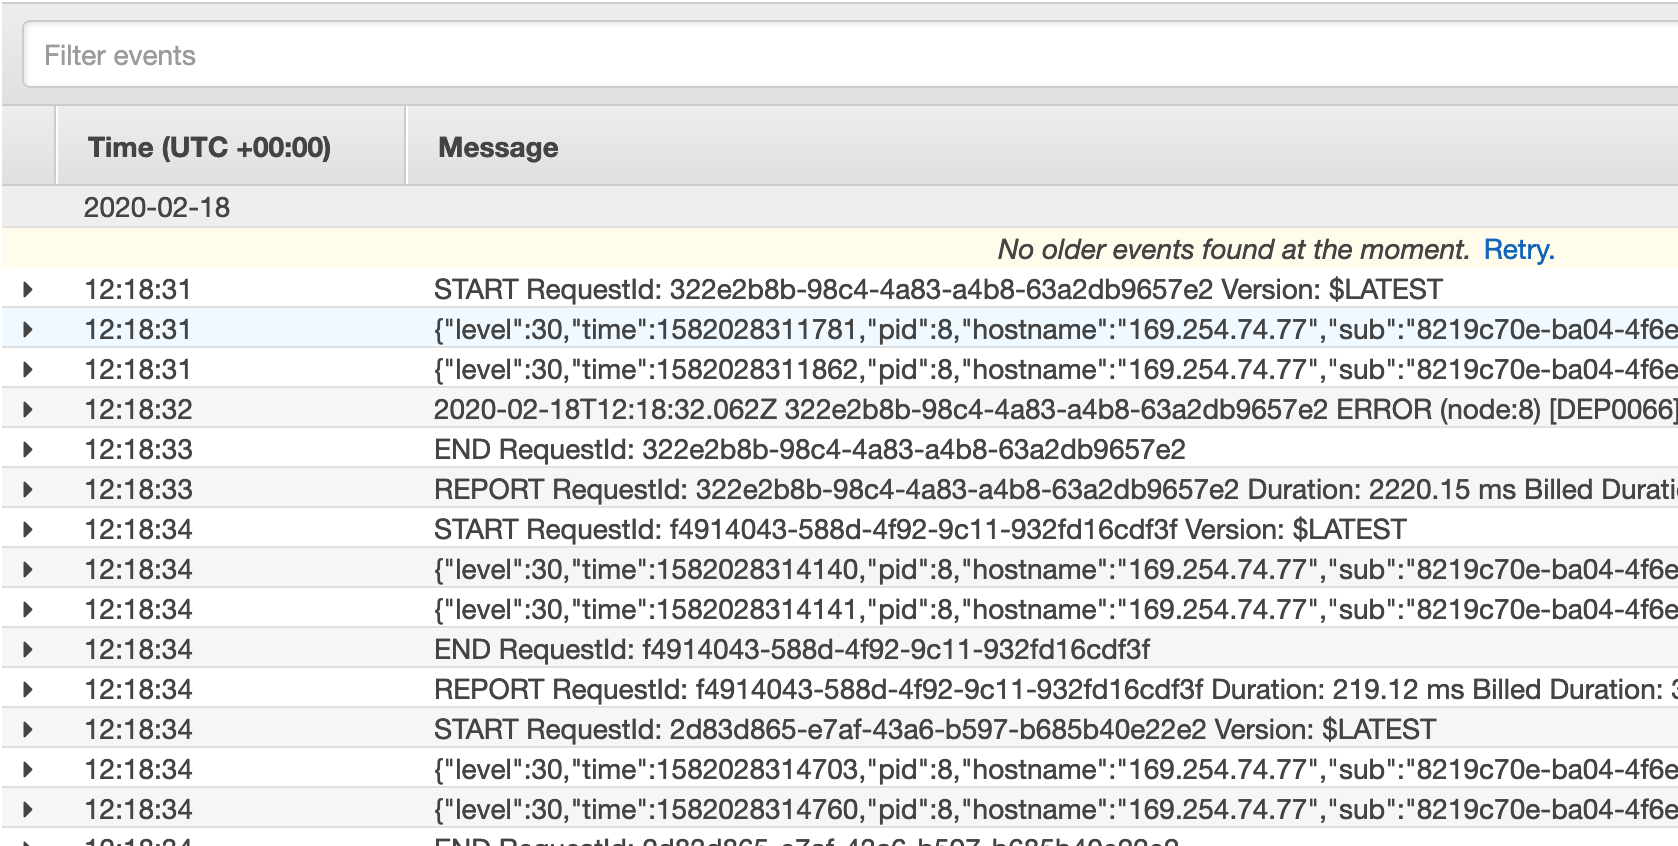
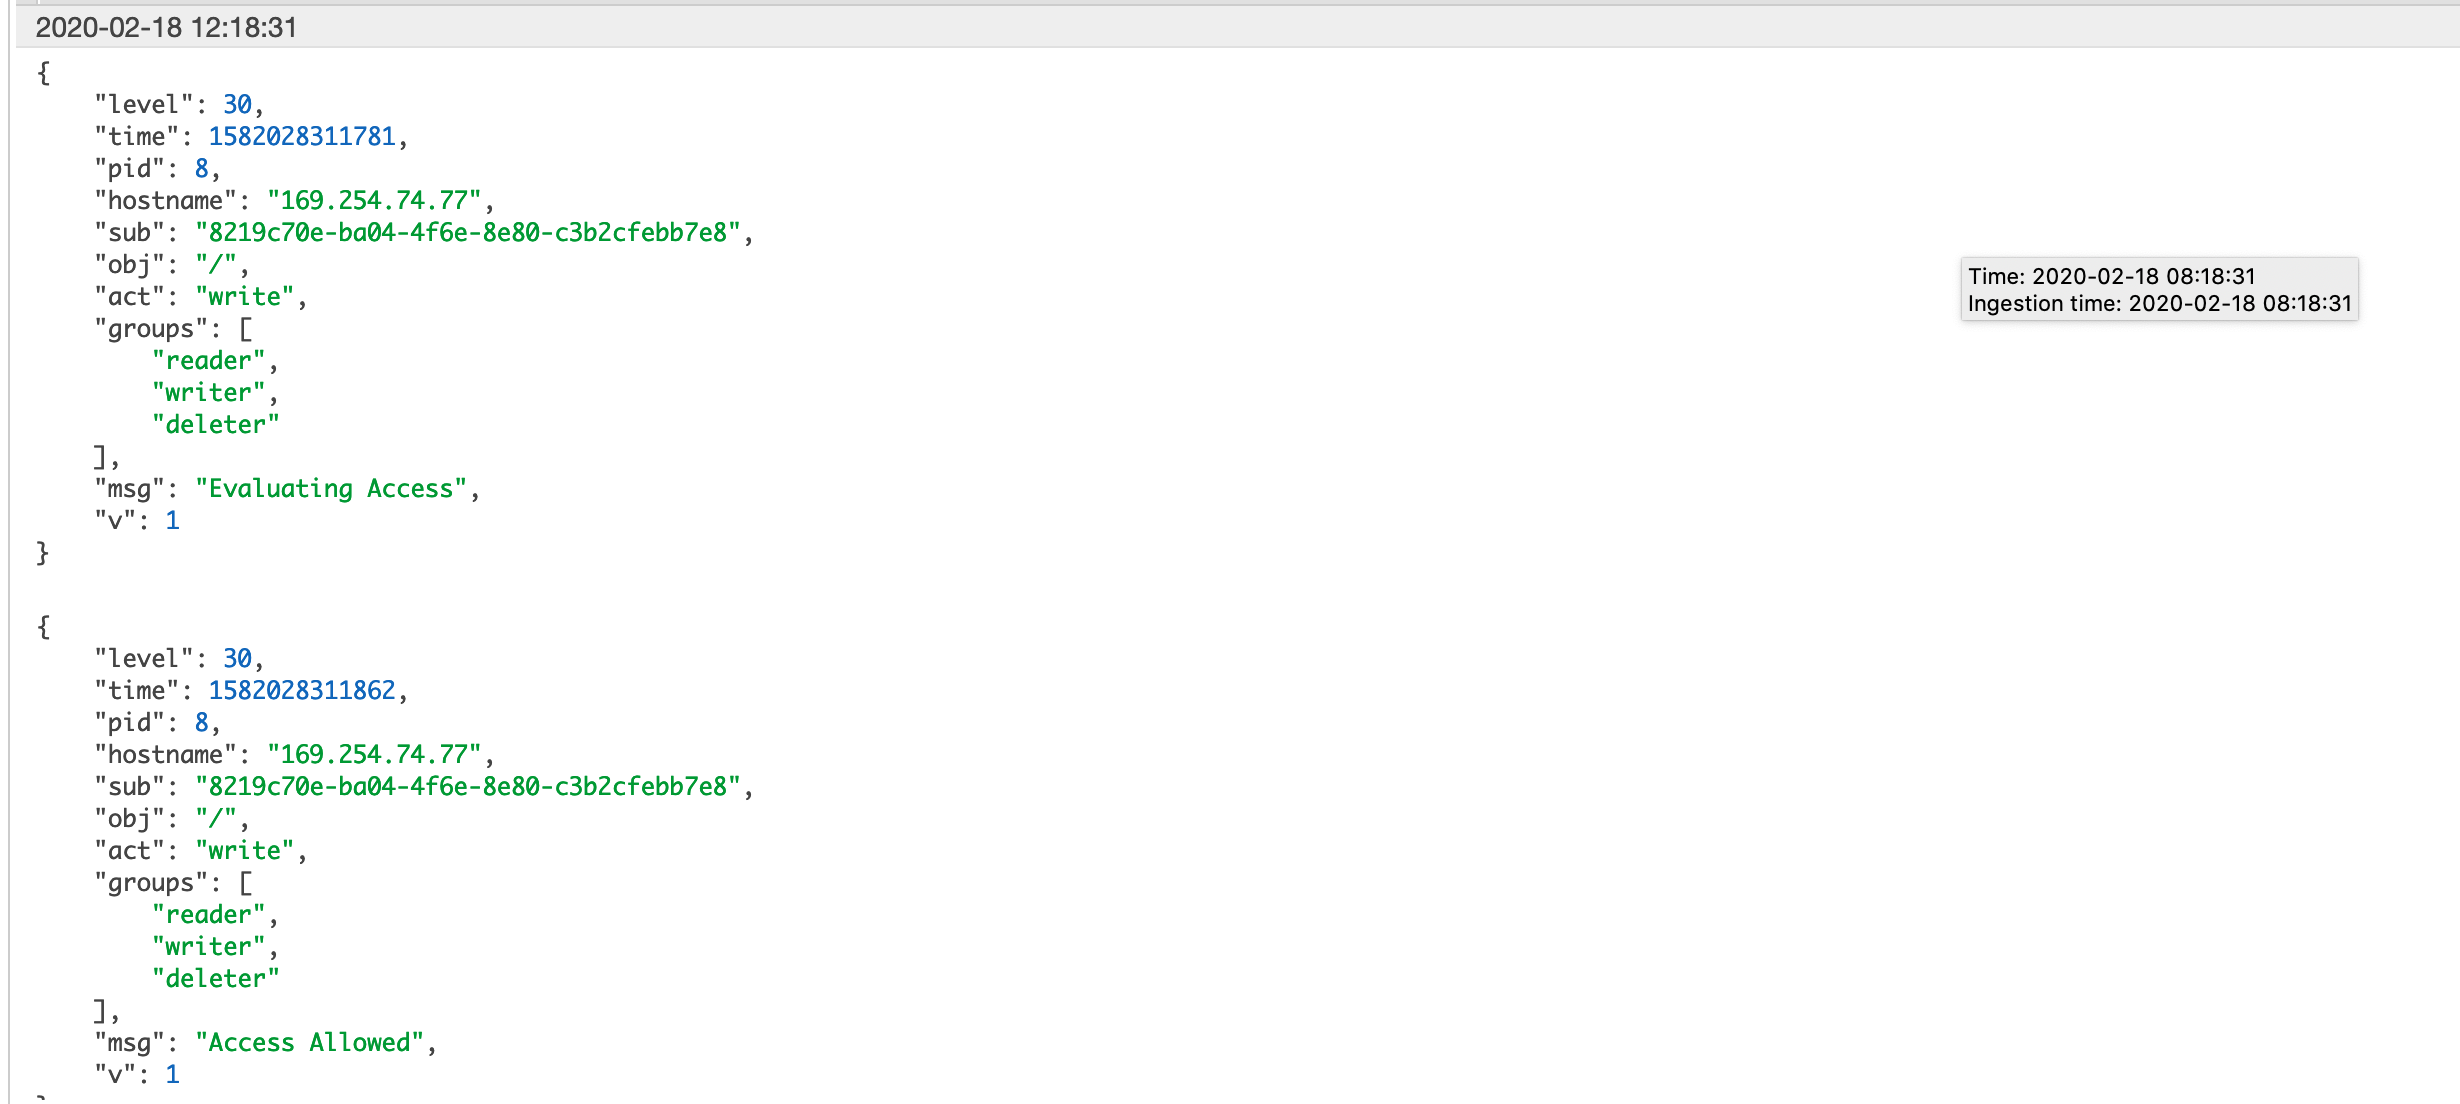
Most centralized logging systems will have no issues ingesting, parsing and searching over JSON structured logs.
Keen eyes will notice that the ‘sub’ field is not particular instructive as to the identity of the caller. Sometimes that can be a handy feature - it’s removed a way to personally identify anyone from the log entry alone. Within certain industries, countries, etc, it can be particularly important to keep sensitive or personally identifiable information (PII) out of your logs.
How to Trace?
We start by installing the xray SDK for node. I needed to install the experimental branch which has support for async/await syntax. This will probably be merged soon.
npm install --save aws-xray-sdk@^2.5.0-experimental.1
XRay can be configured in a myriad of different ways, but this is the way I found simplest.
const xray = require('aws-xray-sdk');

const app = new express();

app.use((req, res, next) => {
    req['segment'] = xray.getSegment();
    req['logger'] = newLogger();
    next();
});
This will cause X-Ray to open a new segment per request, and attach it the request object.
Let’s try to trace our authorization middleware, by using ‘captureAsyncFunc’.
app.use((req, res, next) => {
    const { segment } = req;
    captureAsyncFunc('Auth Middleware', subsegment => {
        const token = req.headers['authorization'];
        const decoded = jwt.decode(token, { json: true });
        const { sub } = decoded;
        const groups = decoded['cognito:groups'] || [];
        const { path: obj } = req;
        const act = methodToAction[req.method];
        req.logger = logger.child({ sub, obj, act, groups })
        rbac.addRolesToUser(sub, groups).then(() => {
            rbac.enforce(sub, obj, act)
                .then(pass => {
                    if (pass) {
                        next()
                    } else {
                        res.status(403).json({ message: 'Forbidden' });
                    }
                })
        }).finally(() => subsegment.close())
    }, segment);
});
This is a fair amount to swallow, but basically…
- We get the segment that was opened earlier and attached to the request object.
- We open a subsegment to track our authorization middleware. The subsegment is named ‘Auth Middleware’, and the logic is passed in as second function, and the third argument is the segment to open this subsegmment on.
- When are ‘done’ with the logic, we close the subsegment, which will occur as soon as the rbac functions have finished.
Instrumenting AWS calls is a bit more straight-forward…
function newS3Client() {
    return xray.captureAWSClient(
        new s3({
            params: { Bucket: env.get('BUCKET').required().asString() },
        })
    );
}
This will ensure our S3 calls are traced. Note that you do need to ensure that they wrapped in their own subsegment when called. E.g. we need open a new subsegment in our particular route handlers. For example, getMessages will now look like the following;
app.get('/', ({ segment, query }, res) => {
    xray.captureAsyncFunc('Get Messages', subsegment => {
        const client = newS3Client();
        const maxItems = query.maxItems || 20;
        const token = query.token;
        getMessages(client, parseInt(maxItems), token).then(response => {
            res.status(200).json(response);
        }).finally(() => subsegment.close());
    }, segment);
});
This is the bare minimum we need to do start adding useful traces. You can add a lot of additional metadata to traces, but for brevity I’ve left this out. It’s worth looking into.
You can check GitHub for the completed code examples. Let’s view the results. I’ve fired off a few random requests, and we’ll inspect the traces to see what we can learn.
The first is a trace map of our service.
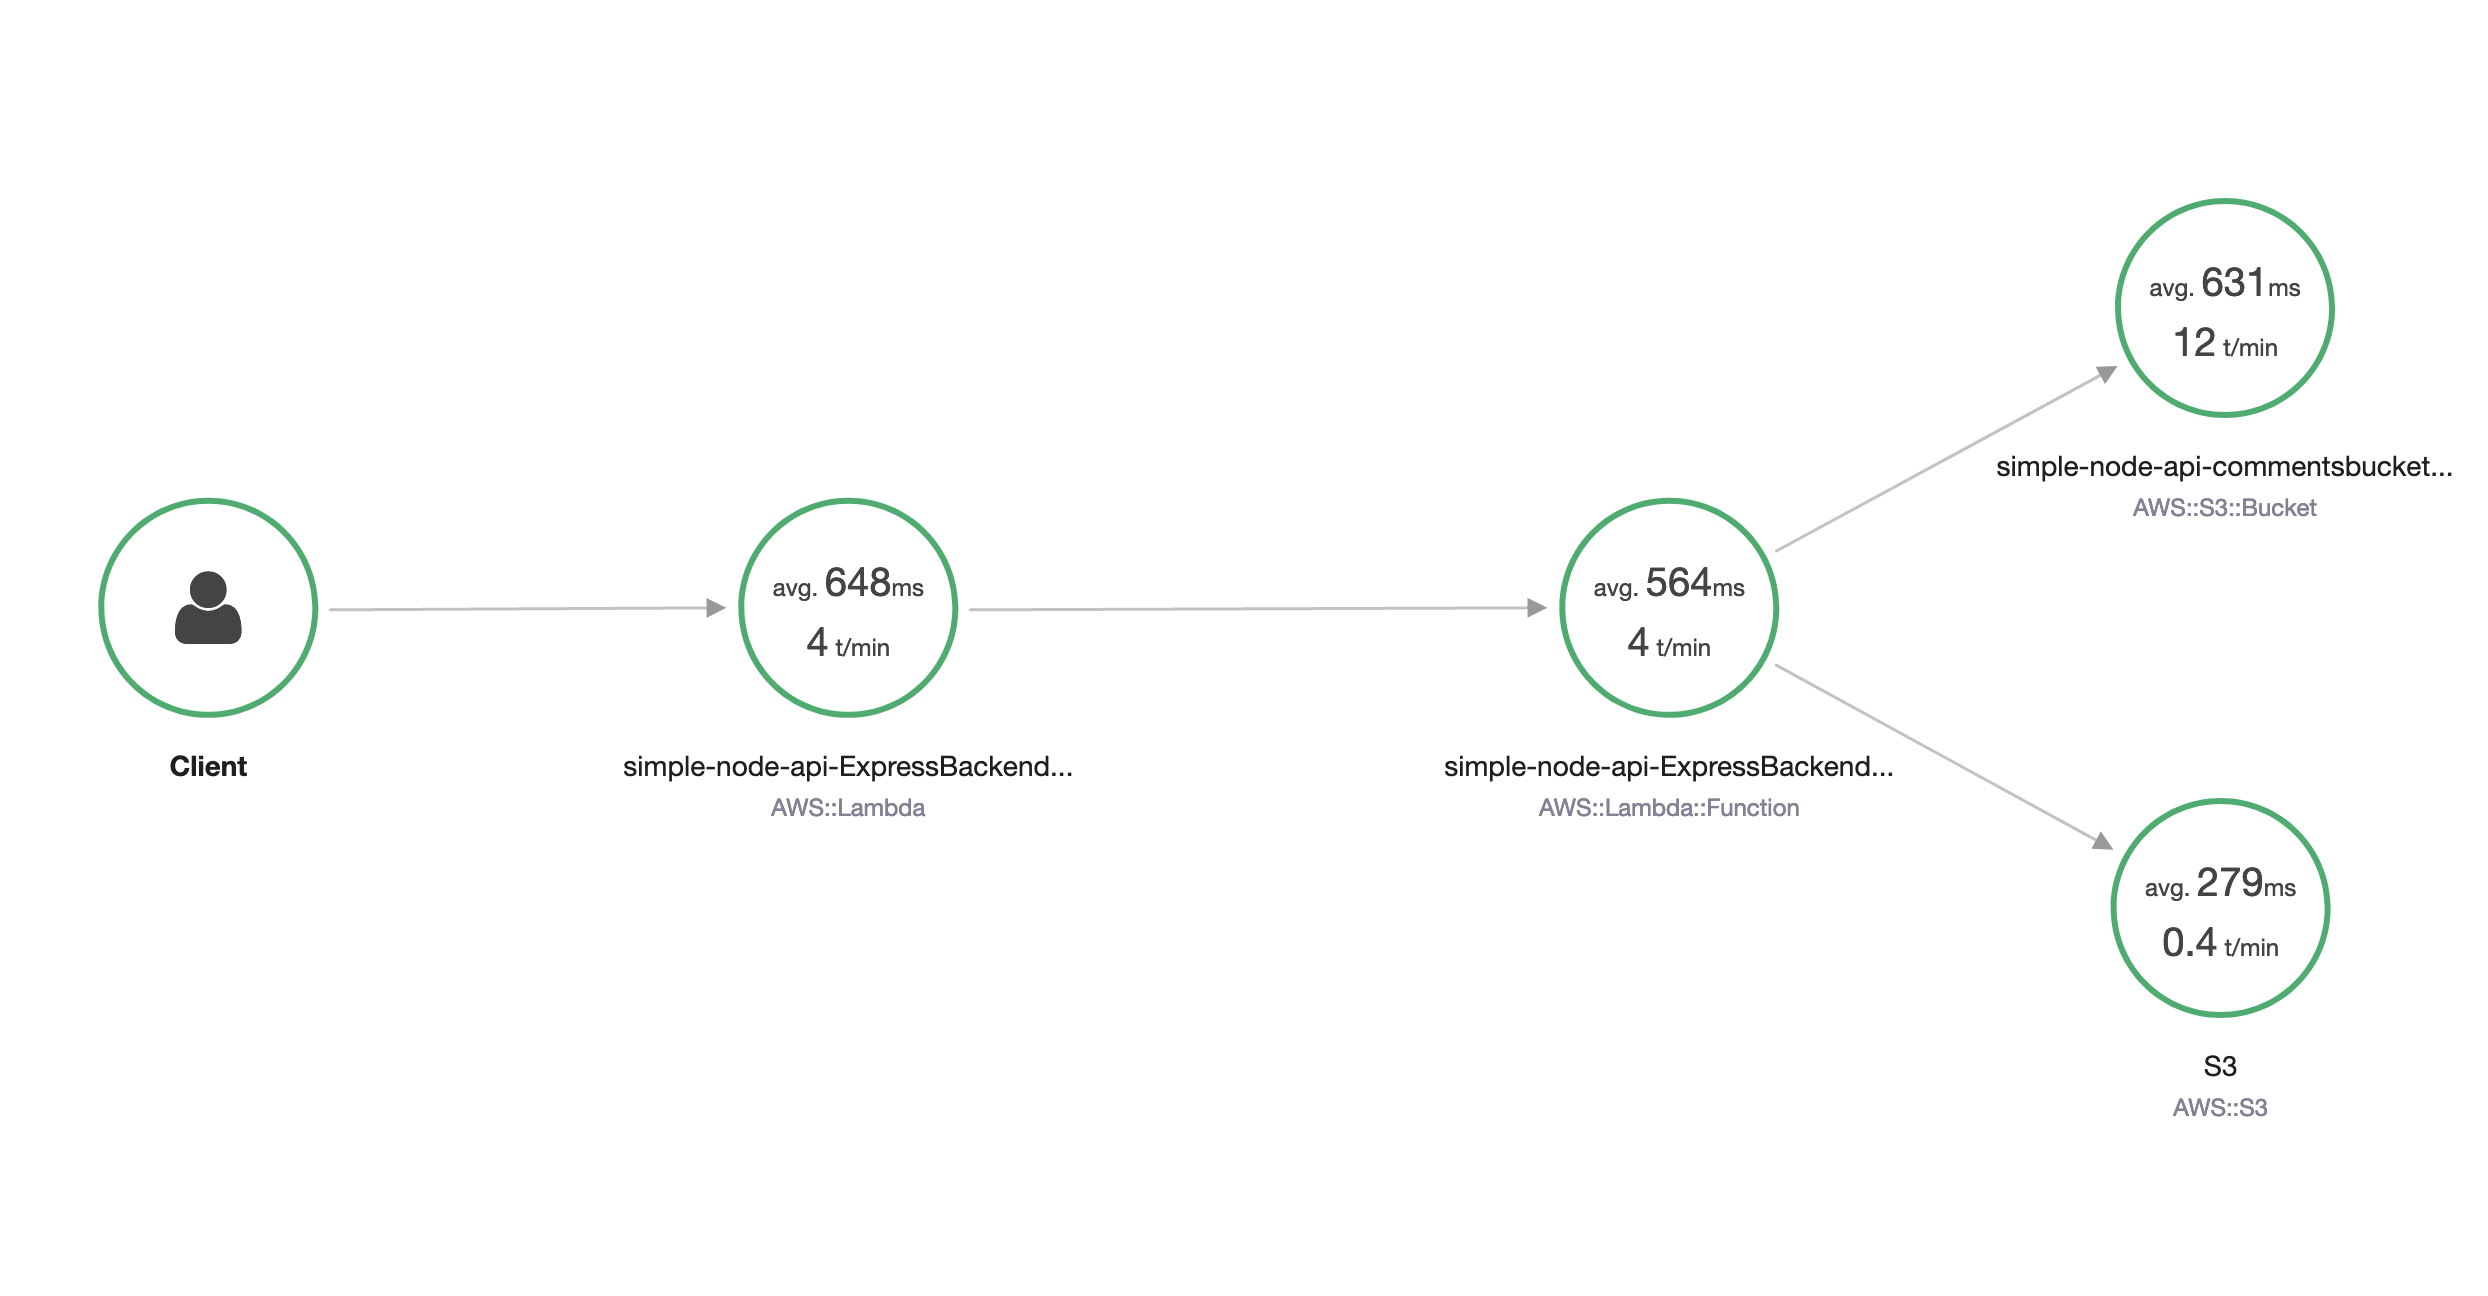
This is a the birds-eye view of our service. From this, we can the average time per invocation and average number of calls per minute, for a particular time scale. We can also see the average calls we made to downstream services, represented by the S3 and S3 Bucket nodes at the right side of the map.
You can get a similar map per trace as well, as shown below.
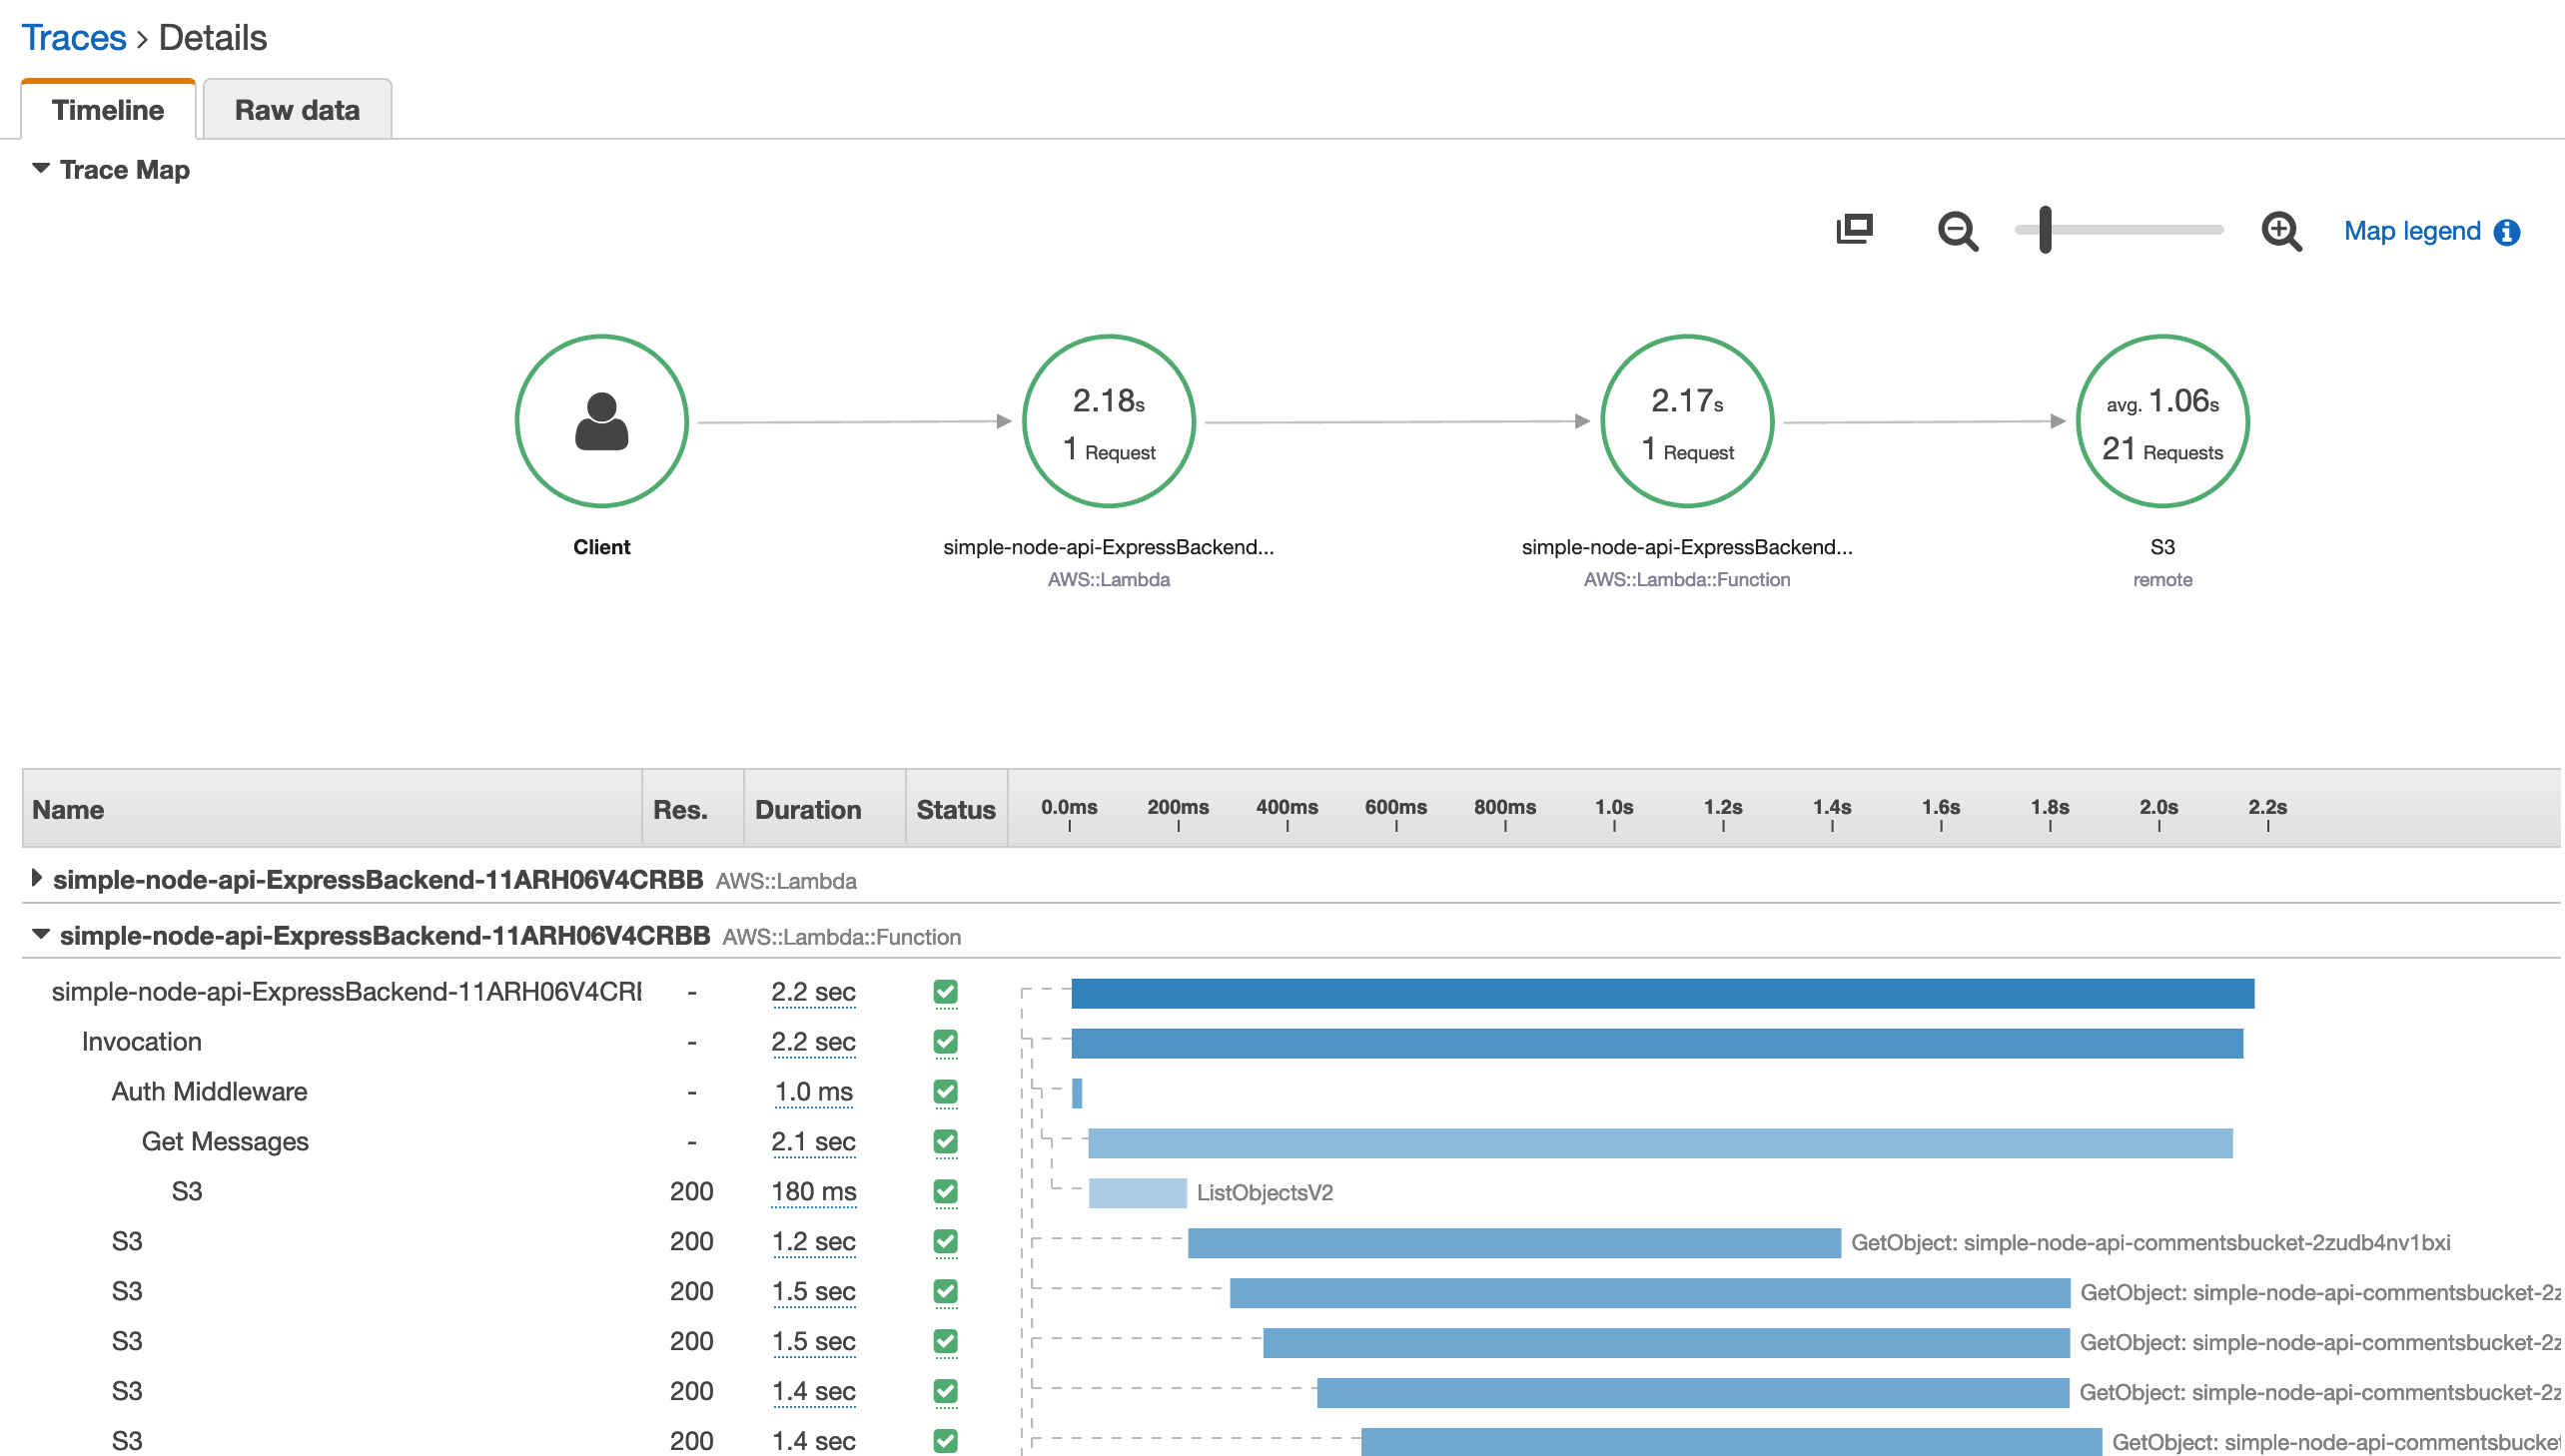
Let’s take a look at those calls below the trace map. This is a trace for one of our ‘get’ calls.
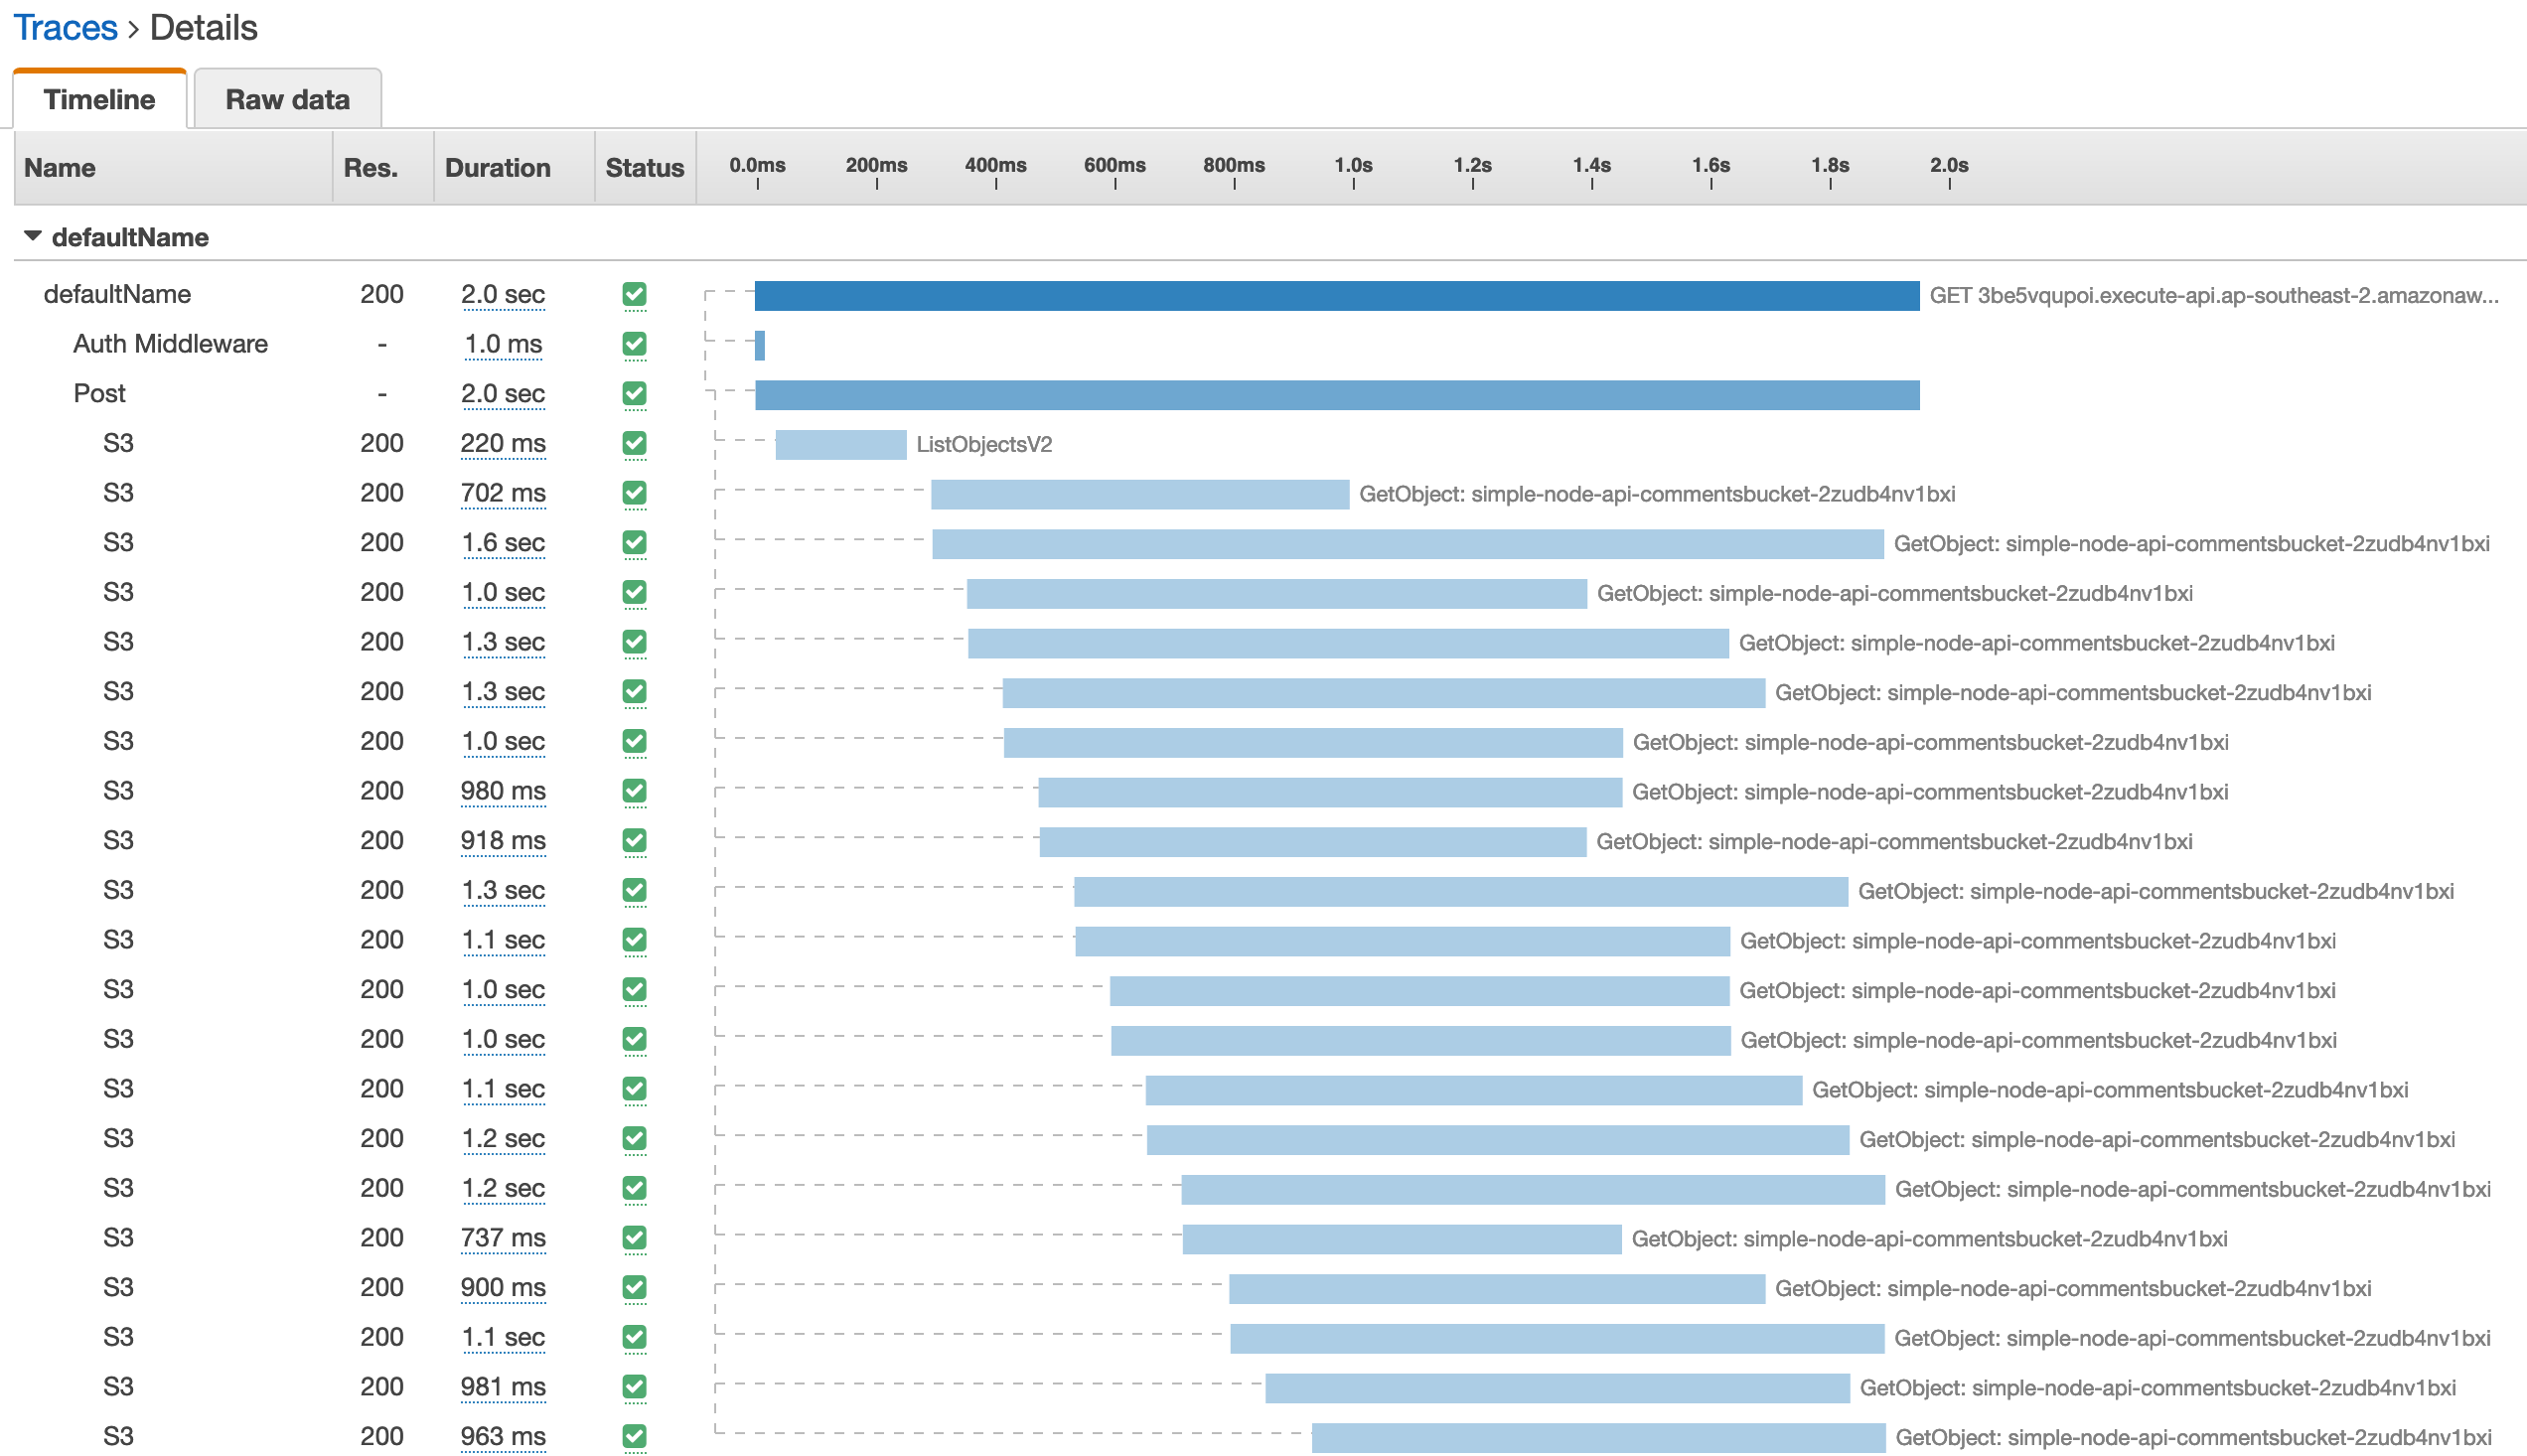
We can learn several things from this trace:
-
Time spent in the auth middlware pales in comparison to our remote SDK calls (as you would expect).
-
Most of our time is spent retrieving comments from the bucket e.g. the list call is pretty quick in comparison.
-
We do our best to fire off all the requests in parallel, but it’s not perfect due to node’s single thread nature.
-
It takes a fair amount of time to retrieve even just one comment from the bucket.
Going back to the trace map, we can click on a particular node and view the distribution of response times.
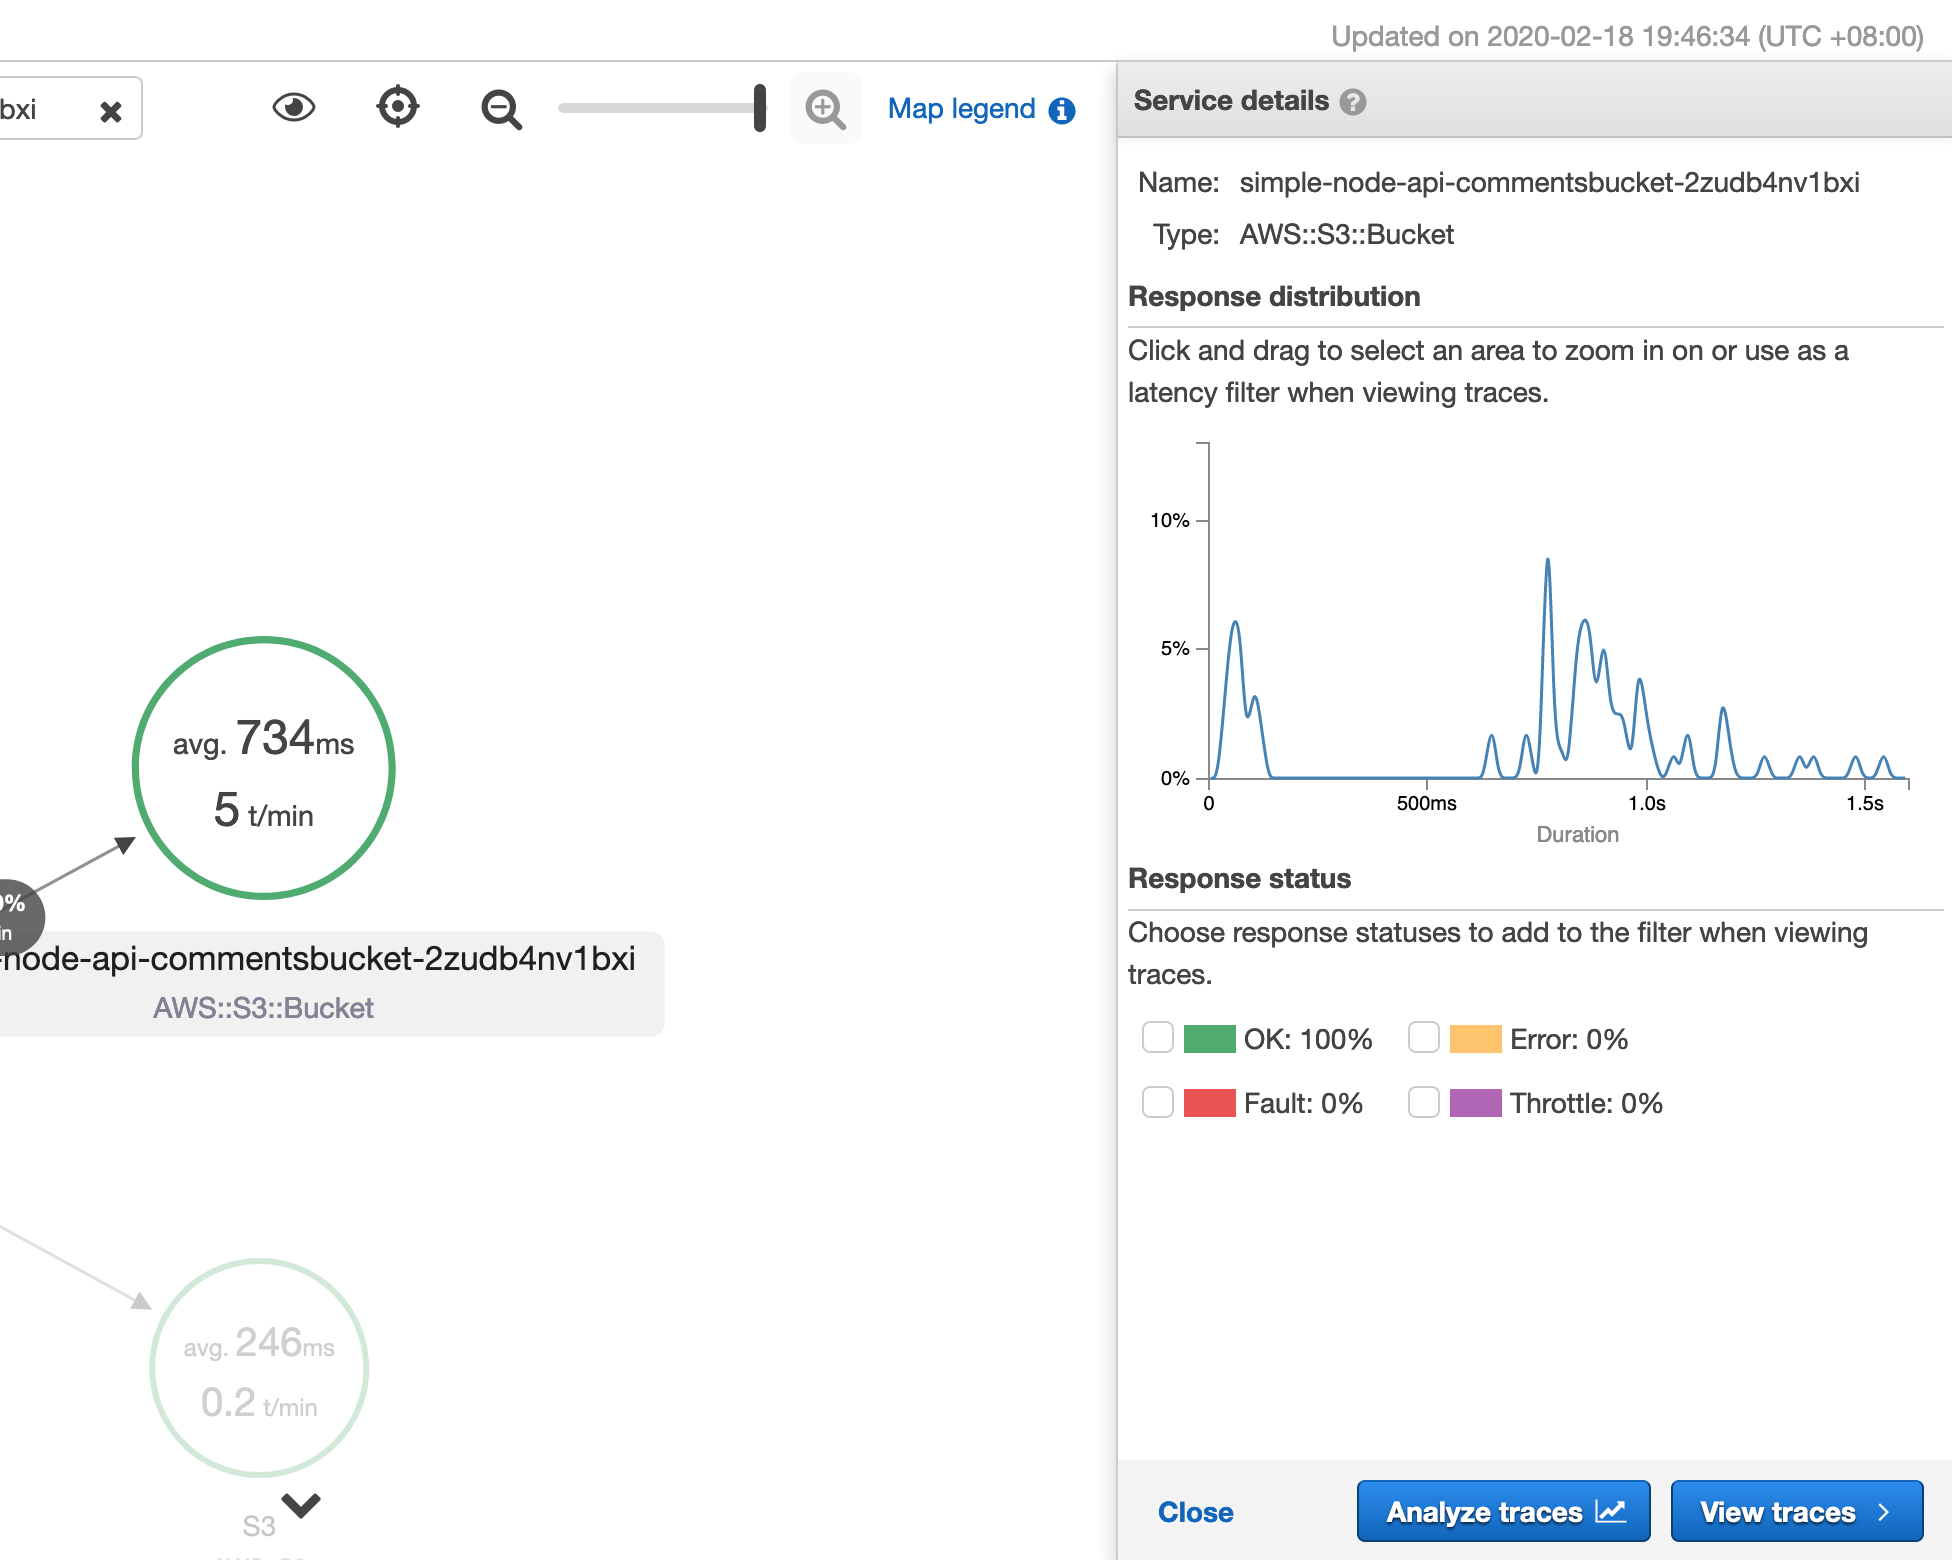
Odds are pretty good a request for a particular item from the bucket is going to take more then half a second. DynamoDB would probably be a better choice - and because we have traced the calls you could make a particular compelling case to change the storage backend.
Conclusion
We took a whirlwind tour of observability, focusing on two of the pillars of Observability: Logging and Tracing. We learned a little about how to configure the default logging and tracing that is inherent in the AWS platform. We then looked enhancing our applications with our own custom instrumentation. We first enabled structured logging in our application, and then showed how to configure tracing in our application using X-Ray. Finally, we had a look at some of the traces in our application and drew some conclusions about how could improve performance.
Starting out with Serverless? Contact Mechanical Rock to Get Started!