Serverless Express - Measuring With Metrics
Tags: javascript tutorial serverless aws
Introduction
The last installment started to cover off on observability of our applications. Observability helps us to answer questions about how well our applications are running in production. We can than use this information to improve our applications over time. Logging, Tracing and Metrics are commonly referred to as the ‘three pillars of observability’. We previously had a look at logging and tracing. Logging allows us to keep persist statements about things that are occuring in our application for various purposes. Tracing is somewhat similar to logging, except it works across system boundaries to ‘trace’ how a request travels through various parts of a distributed systems architecture. I have not covered the third and final pillar, metrics, so let’s dive into it!
Metrics, Dashboards, Alerts - What Are They Good For?
Metrics differ a fair bit from the other two pillars in that they are not statements - they are measurements. Metrics usually have a defined unit-of-measurement, whether that be duration, or a count of events etc. This allows them to be aggregated and vizualized for the purposes of understanding approximations of system performance at different points in time.
- Time of an event
- A measurement
- Dimensions
In practice metrics are used for a few things;
- To compare system performance at different points in time
e.g. metrics can be used to see how a system performs under various different conditions.
- To measure and audit a system to ensure it is meeting various obligations
e.g. It may have been agreed that a system must be available 99.95% of the time, or that 90% of requests should complete in under 50ms, lest the user of the system be compensated.
- To alert when various thresholds are met
e.g. If the system breaches a threshold of errors in a defined period, we should alert somebody so they can investigate the issue.
Metrics need not be restricted to software engineering concerns like uptime and requests-per-second. Metrics that are related to the domain your business operates in (e.g. number of orders) can be very valuable.
In most cases, metrics only help to answer fairly generic questions of performance over time e.g. the ‘what’. To understand ‘how’, and ‘why’, tracing and logging are generally more helpful. This doesn’t stop metrics from getting a disproportionate amount of attention. Metrics are extremely seductive because they are so easy to understand at a glance (green = good, red = bad). A time-poor engineering manager can easily make the transition to a poor engineering manager by placing too much emphasis on metrics. It’s important to realize metrics are like sugar; best taken in moderation as part of a balanced diet.
The worst outcome with metrics is something known as ‘Dashboard Hell’. A team will create a new dashboard and alert for every incident that occurs which wastes significant amounts of engineering effort. Either a team will resolve the underlying causes of the incident (rendering the alerts useless), or the team will eventually be unable to cope with the number of dashboards and incoming alerts, leading to alarm fatigue. Building metrics and alerts at the expense of addressing underlying engineering issues will always result in a dysfunctional team and terrible services.
Unfortunately, most vendors of observability products place too much emphasis on marketing pretty graphs and pictures, and too little on providing engineers with the tools needed to effectively understand their services in production.
Fight me.
Metrics, Alerts, Dashboard on AWS
This pillar is primarily serviced as part of the CloudWatch suite on AWS. CloudWatch includes the ability to use metrics that are natively generated by AWS services and custom metrics that are created via the CloudWatch API. CloudWatch additionally allows users to create alarms when certain thresholds on these metrics are met. Whilst alerts are not created out of the box, many services automatically record sets of metrics.
API Gateway is a good example of a service that has good default metrics collection out of the box - under specific circumstances. API Gateway collects metrics on each route and method e.g. /mypath for method POST. This does require that you configure separate paths in API Gateway; building a lambda-lith, as we have done with express, does not capture this level of detail because we delegating the handling of routing to the lambda function. Generally, the more configuration that is captured at the platform layer, the more information is available to AWS, and hence AWS can provide more out-of-the-box.
The following is an example of metrics and dashboards that are provided out-of-the-box for the API Gateway service. They must be enabled by setting ‘DetailedMetricsEnabled’ in CloudFormation, or setting it via an API.
I am of the opinion that you should avoid custom instrumentation as much possible and allow the platform to take care of it. For AWS that will generally mean configuring your application through platform-level configuration (e.g. CloudFormation) as much as possible. The less code you need to write the better. Other platforms offer similar capability at the code-level but this is usually limited to virtual-machine based languages like Java and C#, where tools are capable of injecting hooks into the language runtime based on intimate knowledge of particular frameworks. This is a bit harder to do in languages like Go and Rust (and even Python and Javascript), and usually restricts developers to a handful of frameworks. I personally find the AWS approach far more flexible.
Custom metrics and the embedded metric format
Whilst you can get some great metrics out-of-the-box, the reality is that you may have a need for something else. This is particularly true of business-level metrics. After all, there is no way for AWS to know what business value your application is providing so I wouldn’t expect any future releases to include them. There are two ways to create custom metrics;
- Use the CloudWatch metrics API, or,
- Use the CloudWatch Embedded Logs Format.
The former used to be the only way to create custom metrics. This involved needing to make a call to the API at some point in your code. A big disadvantage of this is that you need to account for failure of the API call, and it’s impact upon your system. For example, a failing API call to create a custom metric should not result in the failure of a customer ordering a book. Just because you can’t record the metric isn’t a reason to fail a customer order.
Your other alternative is to use the CloudWatch Embedded Logs format. This is the best option if you are already shipping logs to CloudWatch, either via native integration (e.g. because you are using Lambda) or the CloudWatch Logs agent. By structuring your logs in a specific JSON format, CloudWatch will parse your logs for metrics that are embedded within your log messages; creating and recording metrics automatically. This does mean that you need to move to a JSON-based structured logging format, but if you are not currently structuring your logs this is good step to take.
AWS has released a few libraries to make using the embedded format a little easier. The library for node.js (which includes TypeScript definitions) is available here.
The structure of embedded format is fairly similar to the API calls you would have made using the PutMetrics call, so I’ll stick to explaining just the embedded format. Each log message is limited to 256kb. Each log message must be in JSON format and include the following node at the root of the document.
{
    "_aws": {
        "TimeStamp": 1559748430481, // A timestamp in ms time (unix epoch time)
        "CloudWatchMetrics": [] // Metadata about the metrics
    }
}
‘CloudWatchMetrics’ is an array of metric definitions objects. This object includes;
- ‘Namespace’
The ‘grouping’ for the following metrics. This will generally be the type or name of the application.
- Dimensions
Dimensions are typically what you would ‘slice-and-dice’ on. Dimensions is an array of DimensionSets. This is potentially the most confusing part to wrap your head around, so let’s try an example.
Say you were measuring response times for requests that resulted in various status codes. Status codes would be an appropriate dimension. But you may also want to group successful codes (200) together. Maybe it is also worth grouping codes as ‘Success’ (for 200’s) and ‘Failure’ for everything else?. We have a dimension set that looks like ‘[Status, Status_Code]’. Every dimension in the dimension set forms a unique combination. If we had two items in the set for Status (Success, Failure), and eight for status code (200, 201, 404, 403, 401, 501, 502, 503), this would result in sixteen custom metrics created. As you are billed by the custom metric, this can be important to keep in mind.
You usually would not use a high cardinality attribute (e.g. something with lots of unique values) as a metric dimension. This would include things like user identifiers or request identifiers. Each unique dimension in DimensionSet results in a corresponding unique combination with all the other dimensions in the set, and an associated custom metric. This has the potential to get quite expensive, so be conservative with the number of dimensions within a DimensionSet that you define.
- Metrics
Metrics define the name and units of particular metric that you are recording. This is metadata about the values you are recording elsewhere in the structure. E.g. you may declare that there will be an entry with name ‘Time’ with units ‘Milliseconds’. Units are strictly optional and must be of a particular pre-defined datum.
The CloudWatch metrics array is essentially calling out definitions of various attributes that are at the root of your JSON logging message. The following is the example given in the documentation.
{
  "_aws": {
    "Timestamp": 1574109732004,
    "CloudWatchMetrics": [
      {
        "Namespace": "lambda-function-metrics",
        "Dimensions": [["functionVersion"]],
        "Metrics": [
          {
            "Name": "time",
            "Unit": "Milliseconds"
          }
        ]
      }
    ]
  },
  "functionVersion": "$LATEST",
  "time": 100,
  "requestId": "989ffbf8-9ace-4817-a57c-e4dd734019ee"
}
In this example, we can see ‘functionVersion’ has been called out as dimension in the array, with a corresponding metric of ‘time’ of unit milliseconds. The requestId will be more or less ignored, as it is a simple logging attribute. The ‘PutMetrics’ API call follows more or less the same structure, it just wouldn’t include any simple logging attributes.
Kicking The Tyres
Code is available here.
We will adjust our logging by installing the node logging library that AWS provides that conforms to the embedded metrics specification.
npm install --save aws-embedded-metrics
Like before, we will import some functions from the library
const { createMetricsLogger, Unit } = require("aws-embedded-metrics");
and we’ll configure the library by adjusting some middleware.
app.use((req, res, next) => {
    req['segment'] = xray.getSegment();
    const logger = createMetricsLogger();
    logger.setNamespace("simple-node-api");
    logger.setProperty("RequestId", req.headers["x-request-id"])
    req['logger'] = logger;
    next();
});
Here I have created a new namespace (“simple-node-api”), and added a property to record the request identifier.
OK, great. Now we need to record a metric. For the purposes of demonstration, I’ll record the time taken for the authorization middleware to make pass/fail decision. I’m obviously already getting that from X-Ray, but this is purely for demonstration purposes. The middleware now looks like this…
app.use((req, res, next) => {
    const { headers, segment, method, logger, path: obj } = req;
    xray.captureAsyncFunc('Auth Middleware', subsegment => {
        const token = headers['authorization'].replace("Bearer ", "");
        const decoded = jwt.decode(token, { json: true });
        const { sub } = decoded;
        const groups = decoded['cognito:groups'] || [];
        const act = methodToAction[method];

        req.logger.setProperty("subject", sub);
        req.logger.setProperty("object", obj);
        req.logger.setProperty("groups", groups);
        req.logger.putDimensions({ "action": act});

        const currentTime = new Date().getTime();

        rbac.addRolesToUser(sub, groups).then(() => {
            rbac.enforce(sub, obj, act)
                .then(pass => {
                    subsegment.close();
                    if (pass) {
                        req.logger.putDimensions({ "Authorization": "success" })
                        req.logger.putMetric("evaluationTime", new Date().getTime() - currentTime, Unit.Milliseconds)
                        // the call to 'flush' will log out the message
                        req.logger.flush().then(() => next())
                    } else {
                        req.logger.putDimensions({ "Authorization": "failure" });
                        // the call to 'flush' will log out the message
                        req.logger.flush().then(() => res.status(403).json({message: "Forbidden"}))
                    }
                })
        }).catch(() => subsegment.close());
    }, segment);
});
The first thing to occur is setting various properties to record the subject, object and group. I’ll make a dimension out of ‘action’ which is only set to read or write, and therefore is not a high-cardinality attribute. I take the current time, and when evaluation has finished, I can record the time it finished. I then record the difference in time as a metric. The metric will have a dimension to indicate whether it succeeded or failed.
The output in the CloudWatch logs will look like the following…
{
    "LogGroup": "simple-node-api-ExpressBackend-V53ZHQ8TGB1Y",
    "ServiceName": "simple-node-api-ExpressBackend-V53ZHQ8TGB1Y",
    "ServiceType": "AWS::Lambda::Function",
    "action": "read",
    "Authorization": "success",
    "RequestId": "KgRJujF0SwMEPLQ=",
    "subject": "0348f283-442b-4e5c-a9a8-da6d3f284ea9",
    "object": "/",
    "groups": [
        "writer",
        "deleter",
        "reader"
    ],
    "executionEnvironment": "AWS_Lambda_nodejs12.x",
    "memorySize": "128",
    "functionVersion": "$LATEST",
    "logStreamId": "2020/04/05/[$LATEST]8514dba7bc7d4a8bbb48505f02ad6380",
    "traceId": "Root=1-5e899571-26ba38ebe8846762aedb813e;Parent=dc867b62be8a635d;Sampled=1",
    "_aws": {
        "Timestamp": 1586074994255,
        "CloudWatchMetrics": [
            {
                "Dimensions": [
                    [
                        "LogGroup",
                        "ServiceName",
                        "ServiceType",
                        "action"
                    ],
                    [
                        "LogGroup",
                        "ServiceName",
                        "ServiceType",
                        "Authorization"
                    ]
                ],
                "Metrics": [
                    {
                        "Name": "evaluationTime",
                        "Unit": "Milliseconds"
                    }
                ],
                "Namespace": "simple-node-api"
            }
        ]
    },
    "evaluationTime": 241
}
Once the code is deployed through sam build && sam deploy --guided, we can send some requests off which should make the metrics appear in the console. A script like the following can help with that.
#!/bin/zsh

# Your API endpoint address is available from the output of your deployment
ENDPOINT=https://otax9va024.execute-api.ap-southeast-2.amazonaws.com

# Aquire a token through your cognito endpoint
TOKEN=''

# this should return nothing e.g. {"Items":[]}
curl $ENDPOINT

# now send some data
for i in {1..10}; do
    curl -XPOST -H "Content-Type: text/plain" -H "Authorization: Bearer $TOKEN" -d "Message: $i" $ENDPOINT
done

curl -H "Authorization: $TOKEN" $ENDPOINT
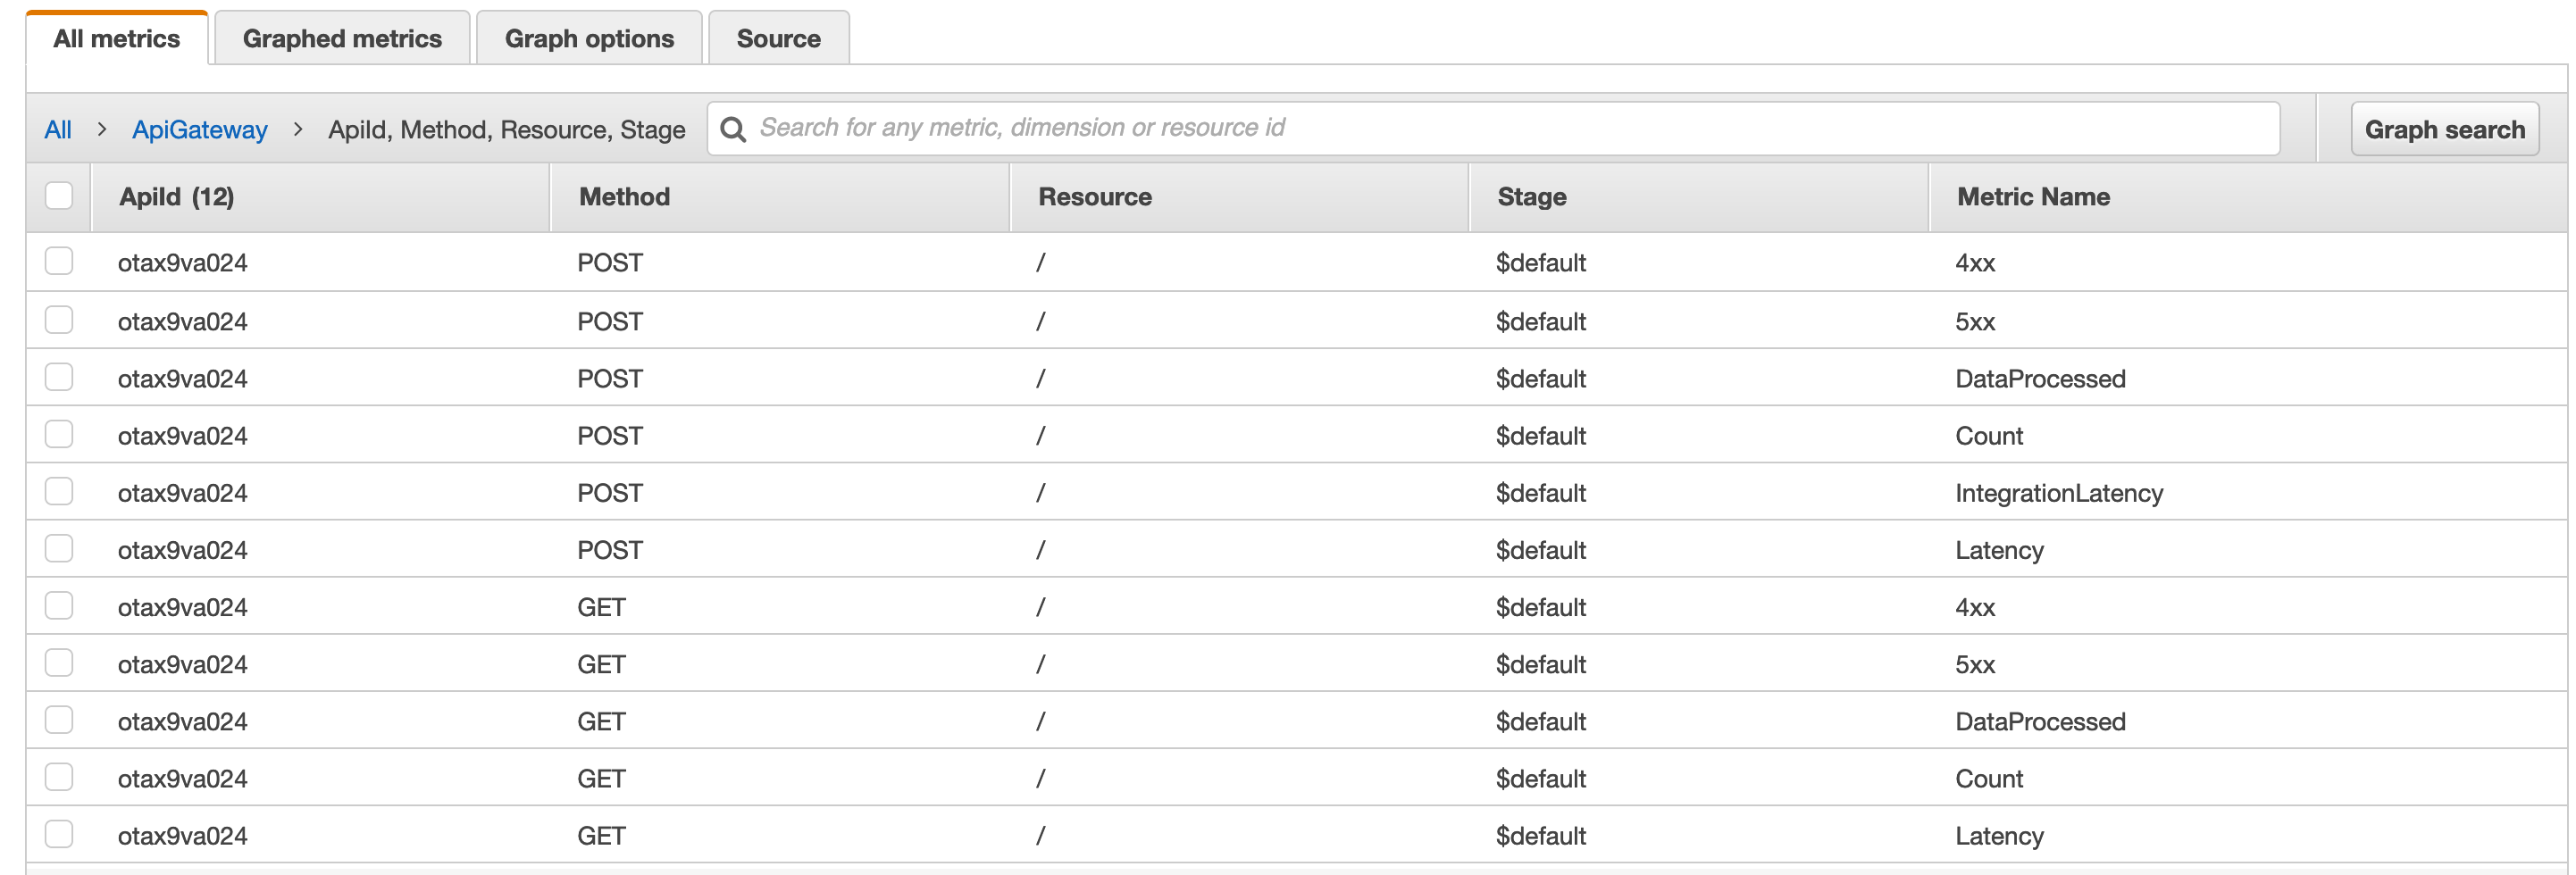
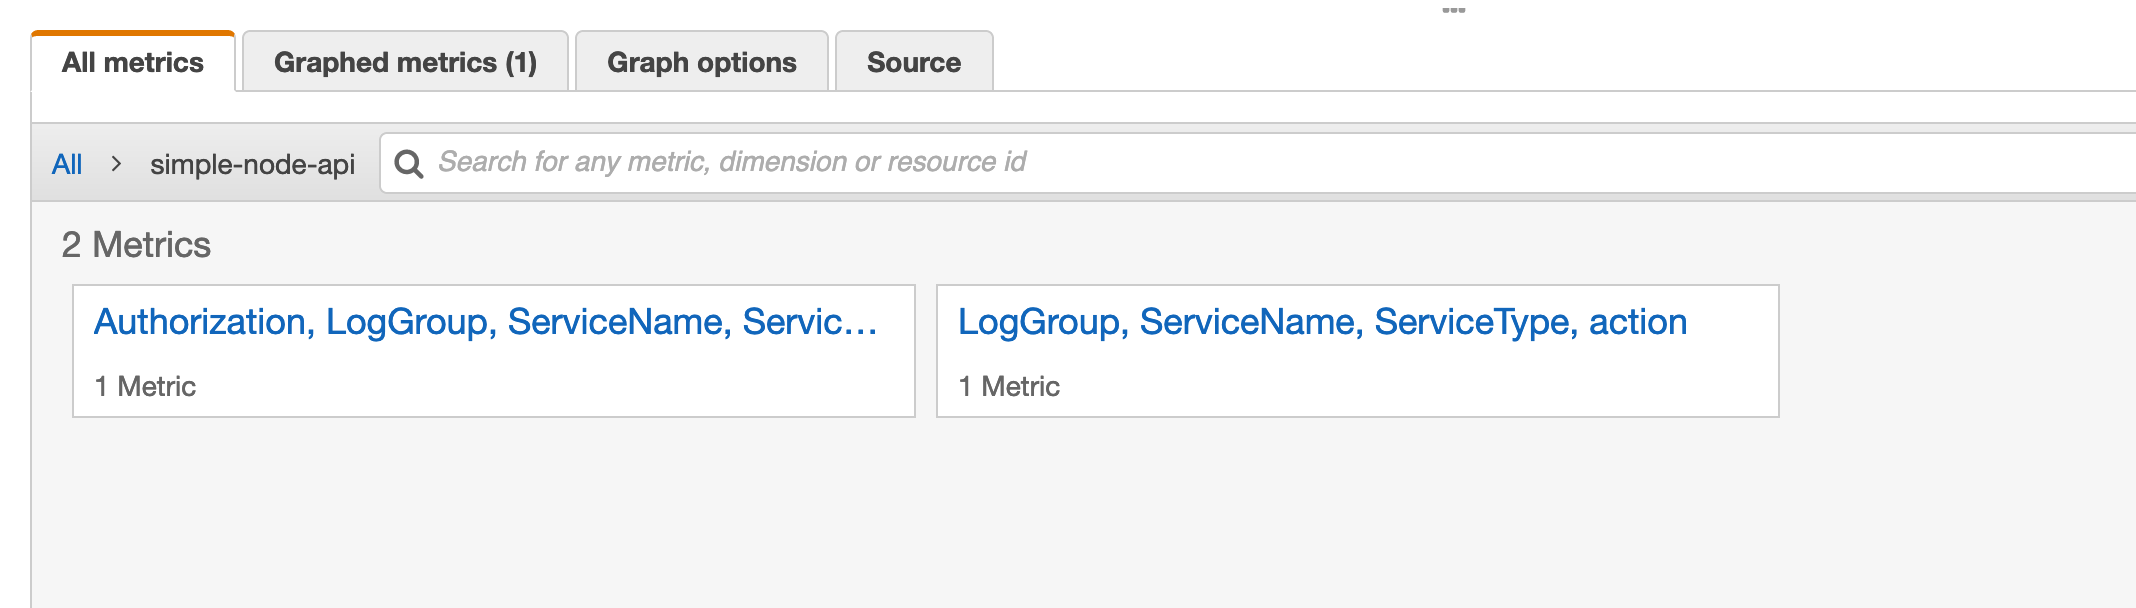
In the console we can find the metrics that we previously defined.
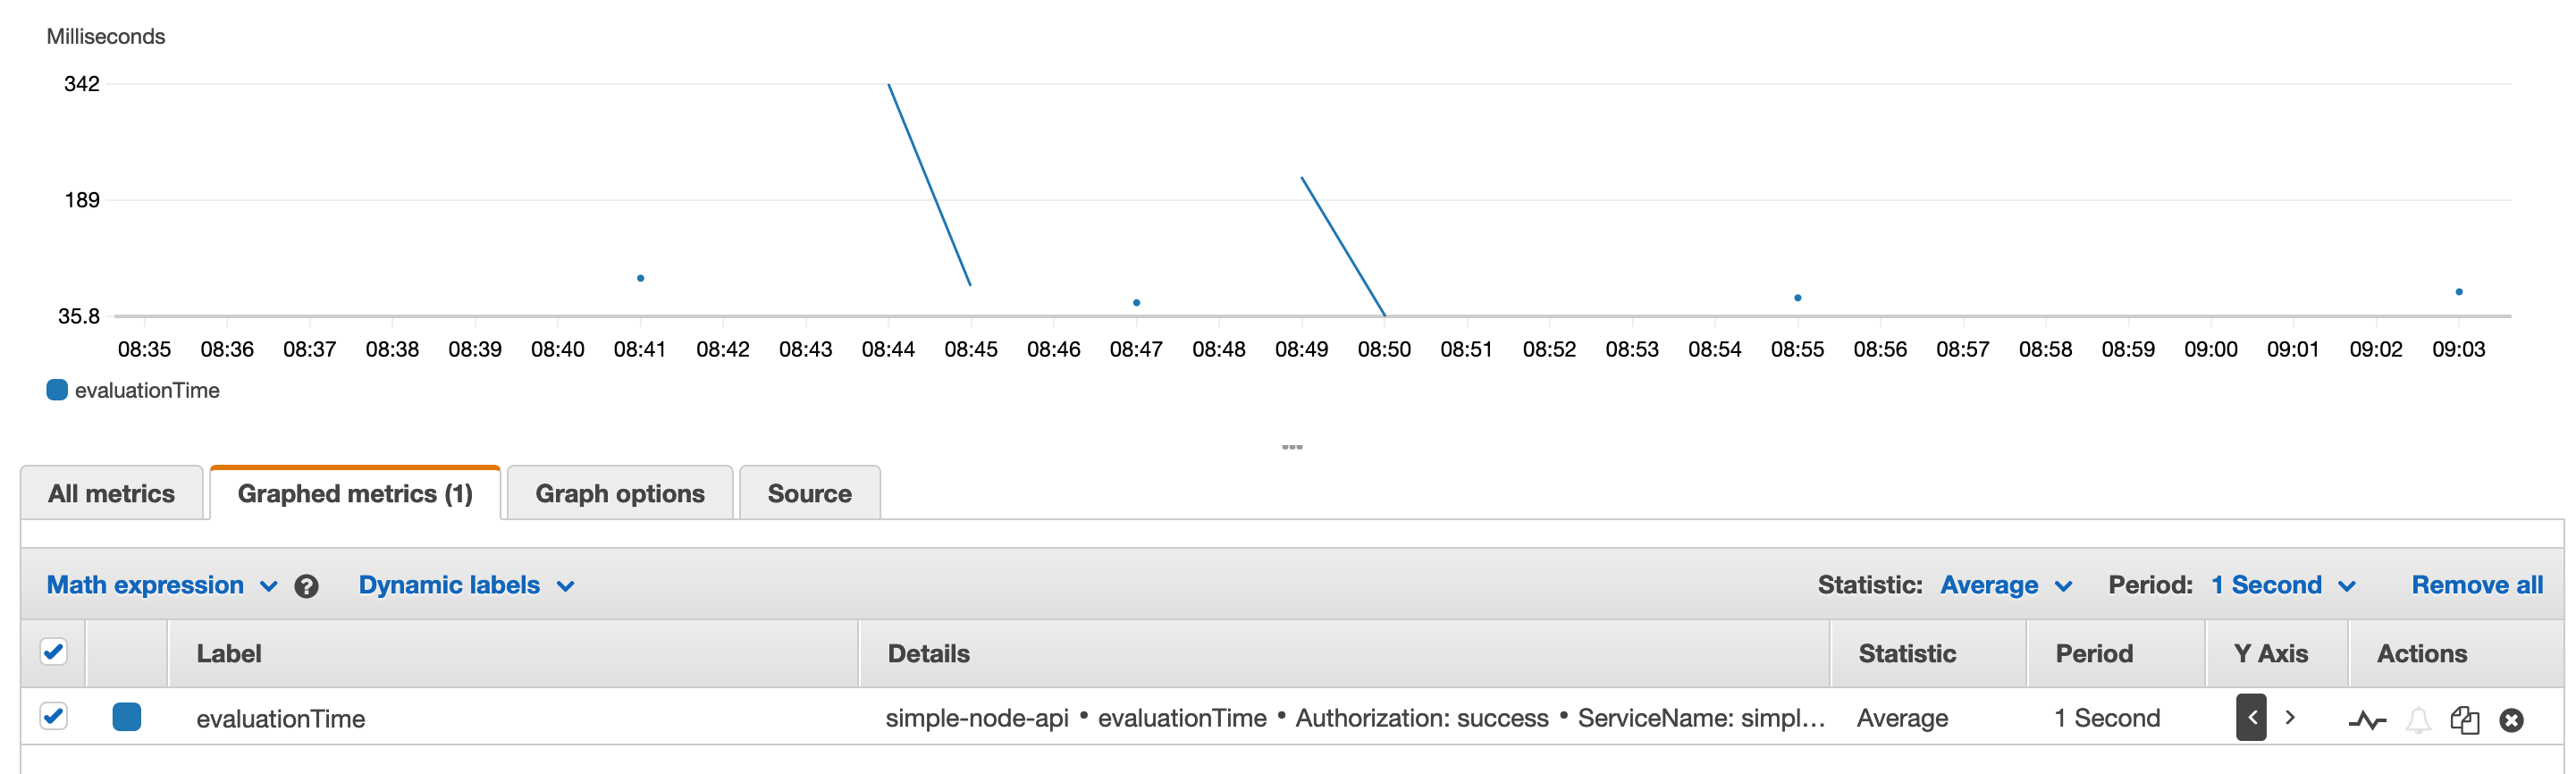
We can graph metrics with various kinds of aggregations including averages…
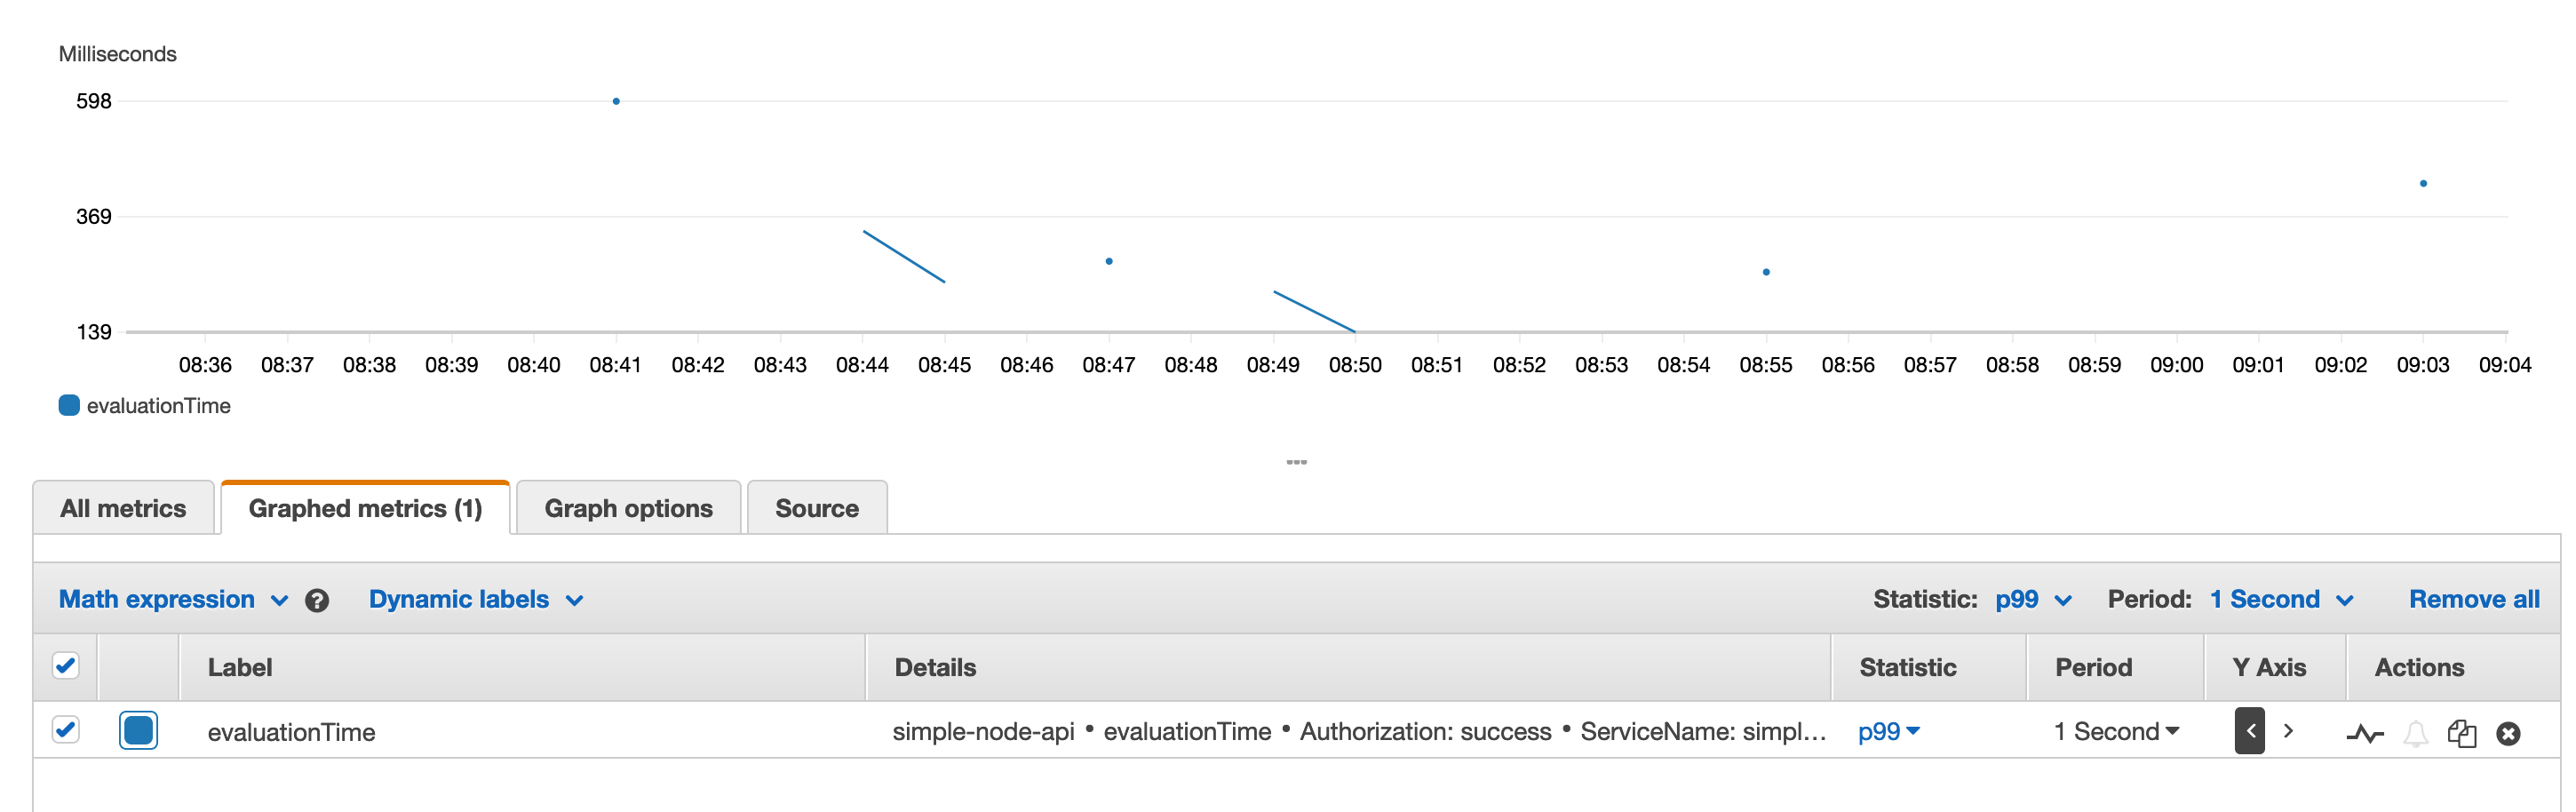
or percentiles…
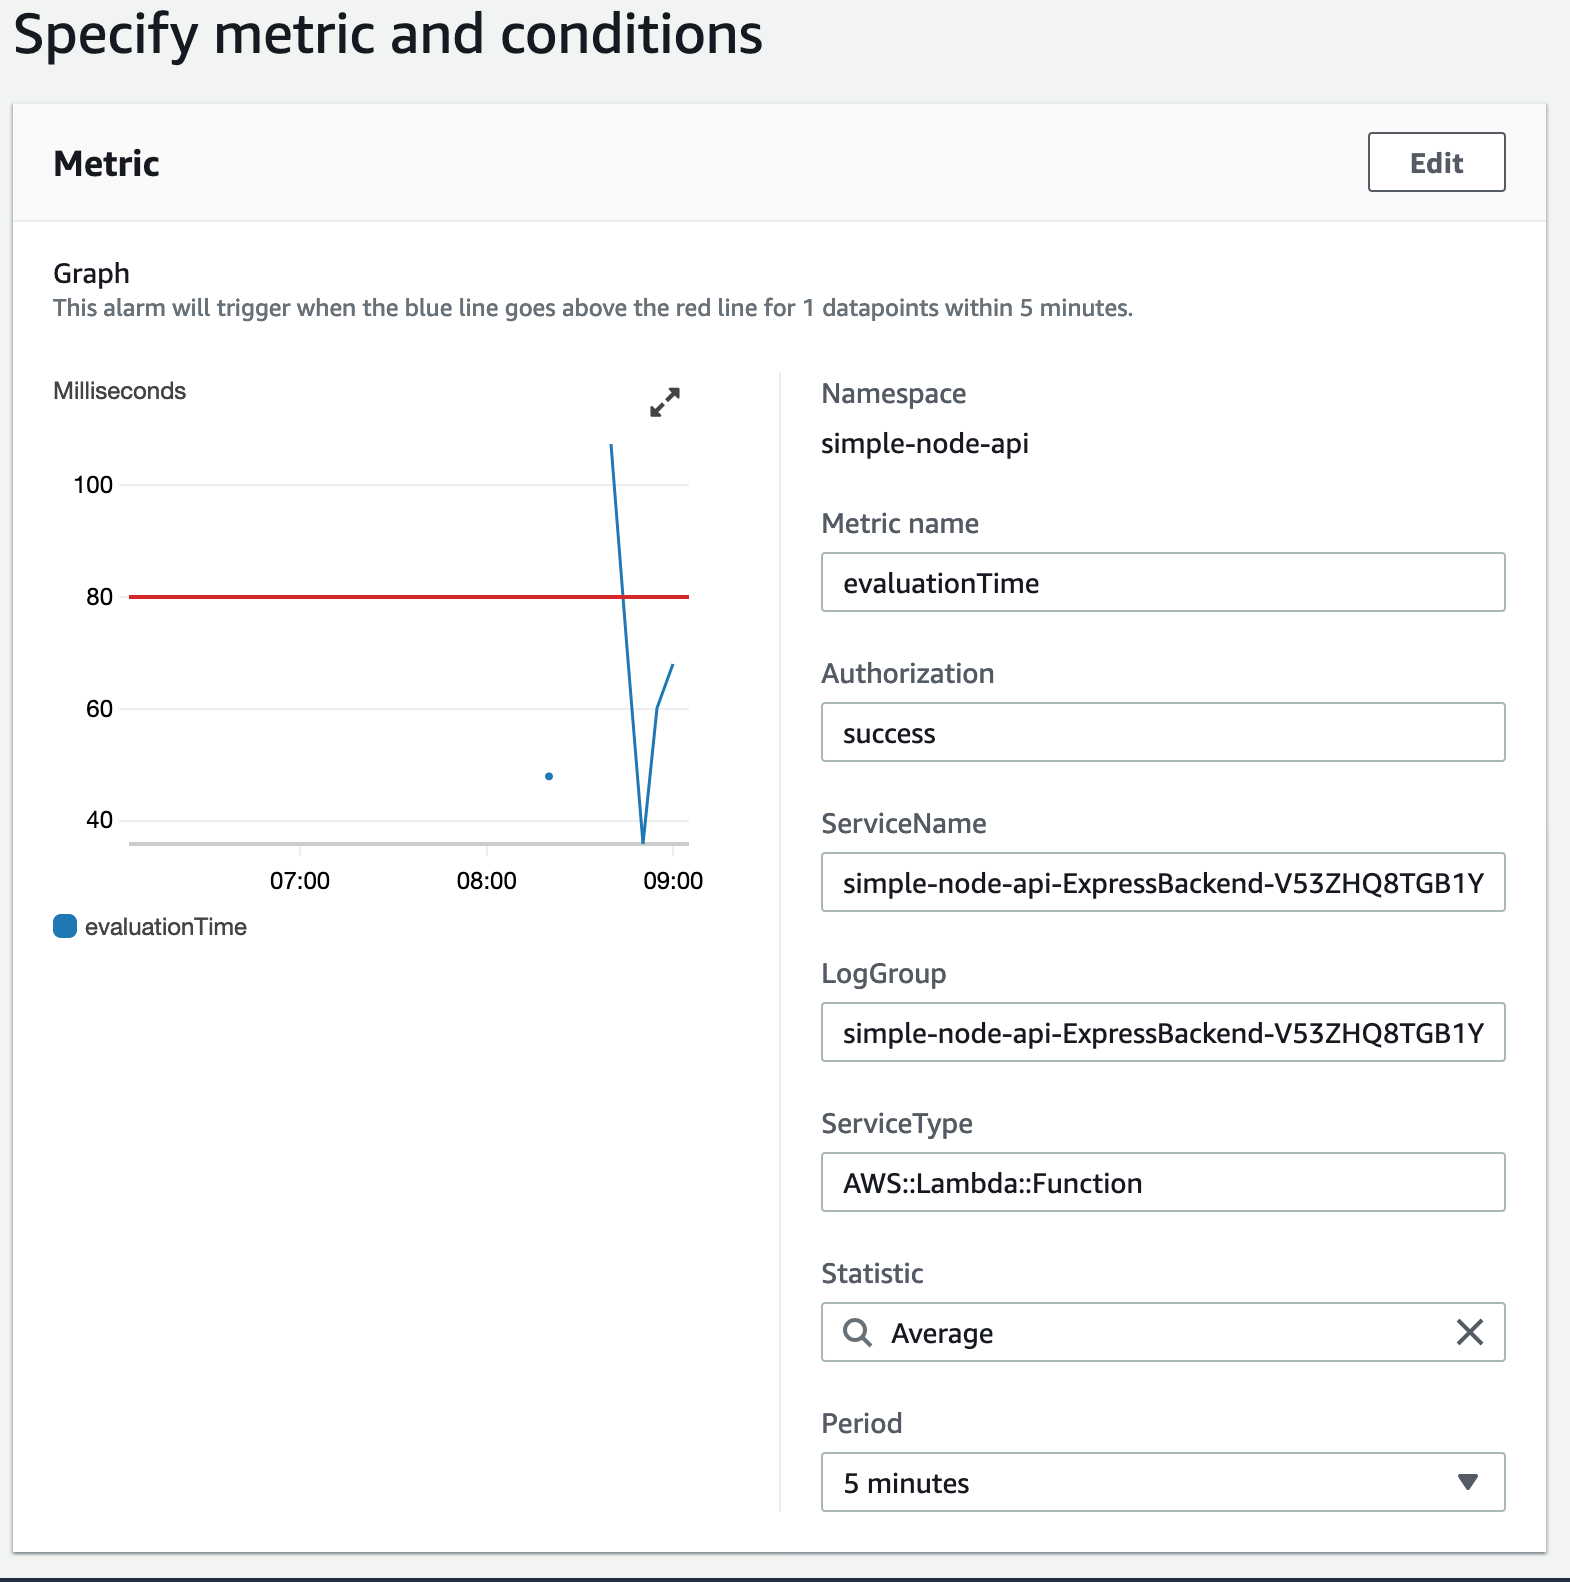
We can also define alarms…
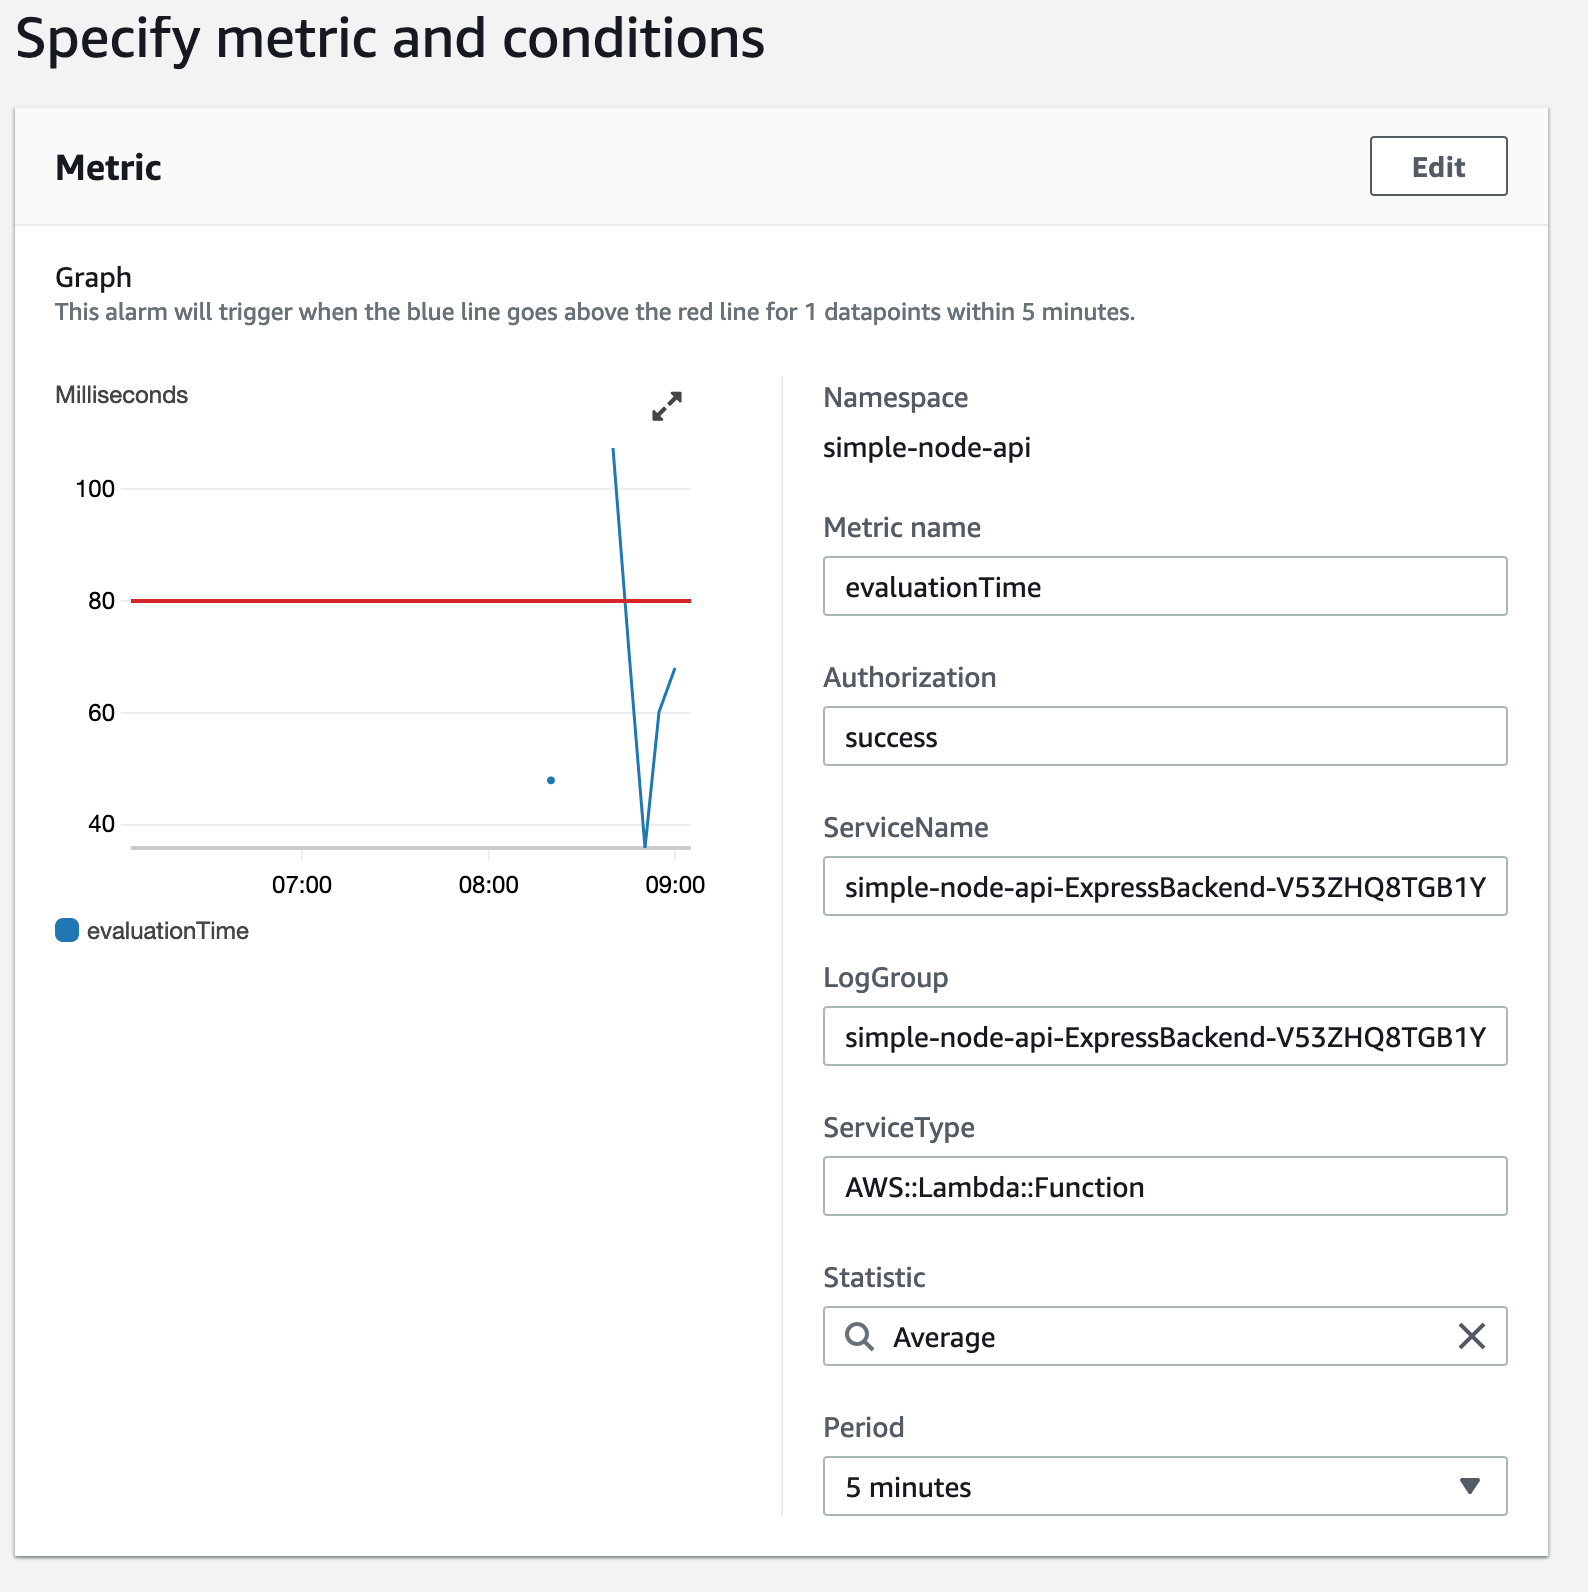
when certain conditions are reached…
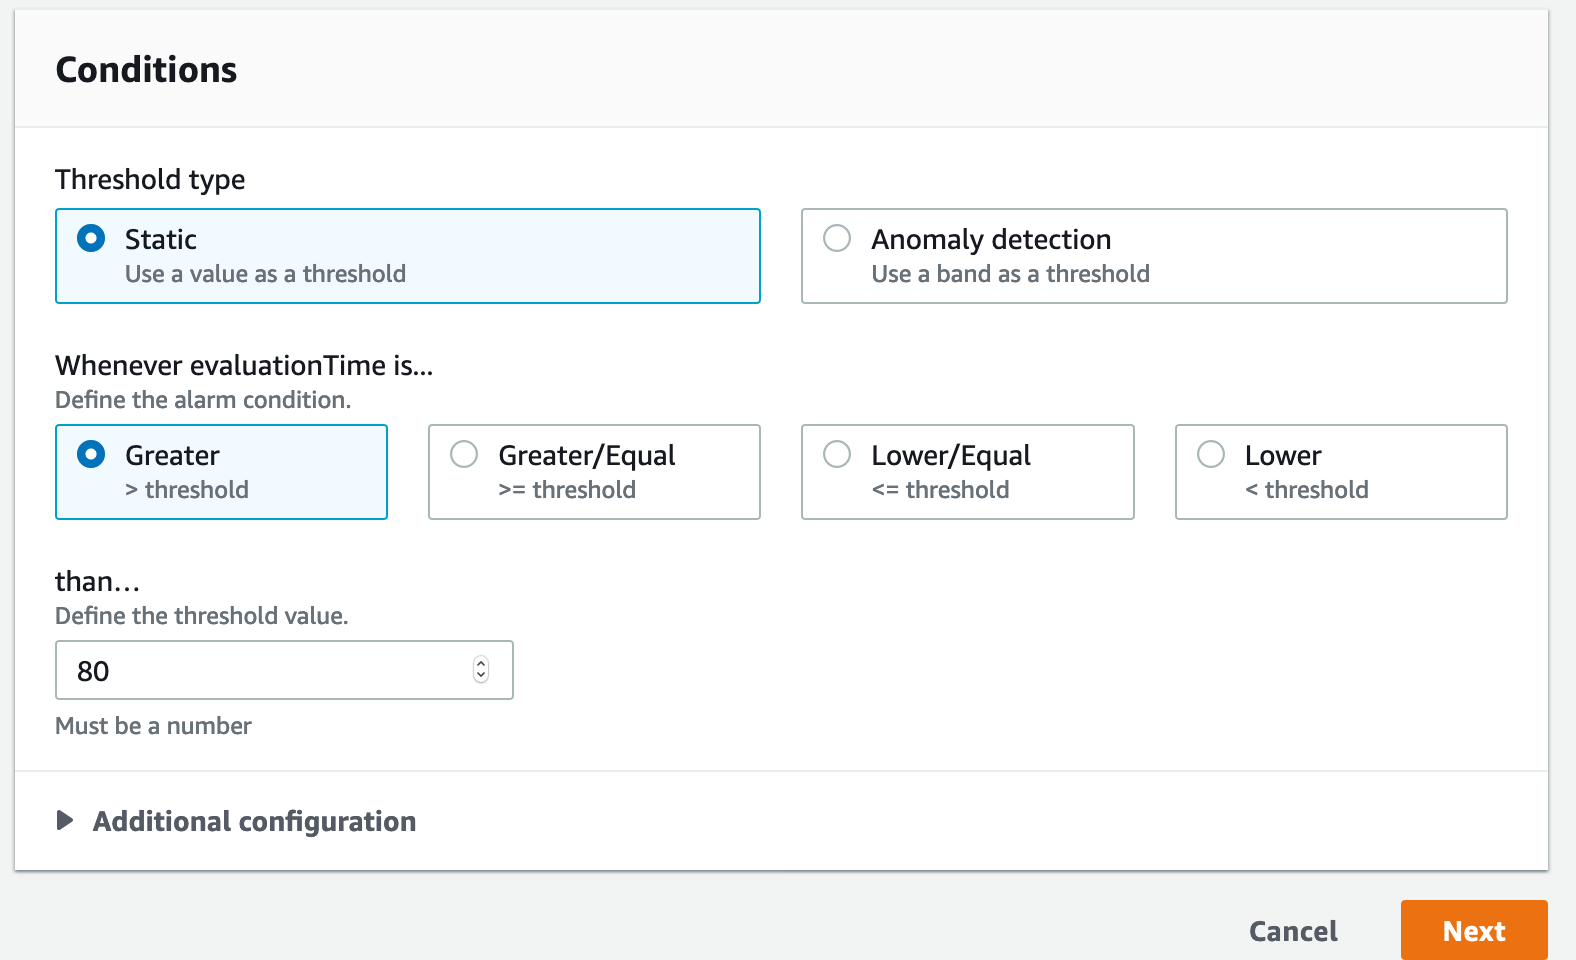
and preview them against recent metric collection.
Simples!
Conclusion
In this article we took a look at the last pillar of observability: metrics. We discussed various ways metrics are used out in the real world, and how they compare in usage to logging and tracing. We then look at ways we can use metrics in AWS, either through in-built metrics provided by the platform, or by defining custom metrics. We defined our custom metric in the serverless express app using the CloudWatch embedded logs format through an AWS provided logging library. We then viewed this metric in the console, and saw how to set up alarms on it.
‘Everying-on-Fire’ becoming ‘Business-as-Usual’? Contact Mechanical Rock to Get Help!